Chapter 6. Data Evaluation
Table of Contents
6.1. Introduction
As soon as Recording in the status box (see Section 3.2, “Global Control Elements”) is switched on, Meteo-42 records and stores measurement data. In order to check current data, the web interface offers the possibility to have see the live data (see Section 6.2, “Live Data Page”). In the menu, measurement data can be downloaded (see Section 6.7, “Access to Source Data” and Section 4.2, “System Administration”) and statistics can be configured, which will be saved into CSV files.
6.2. Live Data Page
This page displays the currently measured data. The data are presented in a table and in a line chart.
Click on Start to display currently measured values. Stop pauses displaying data. The table shows all available data. In comparison, the line chart can be customized by choosing sensors and connected channels.
![[Note]](admon/note.png) | Note |
|---|---|
Enable JavaScript in your web browser to display live data in a chart. |
6.2.1. Publishing live data
The Meteo-42 can be configured to publish live data every second to an XMPP server using the publish-subscribe extension. The data are published using SSL/TLS encryption in JSON format.
Multiple clients can efficiently subscribe to and process the data. The Ammonit Live Data Aggregator is a tool to generate and send statistics files using the published data which is configured on AmmonitOR. Ammonit Live Dashboard is an interactive program which visualises live data in the browser.
Publishing is disabled by default, indicated by "Status: inactive". When data is being published successfully, it will show "Status: active".
- Livedata server
Select to which server you want to publish your data to. You can choose between No livedata server, Ammonit livedata server and Custom server.
- Publish live data to server
Enable this checkbox to publish live data, every second by default.
- Publish average data to server
Enable this checkbox to publish average data as defined by the Statistics interval for Livedata, Logic Controller and SCADA (see Section 6.3.1, “Configuring Statistics and CSV files”).
- Publish logbook to server
Enable this checkbox to publish logbook messages (see Section 4.9, “Using the Logbook”).
- Server name
The name of the XMPP server to which the data should be published. If you selected Ammonit Livedata server as your Livedata server above, you will not be able to change this parameter.
- Server port
The TCP port for incoming XMPP connections, e.g. 443 or 5223. If you selected Ammonit Livedata server as your Livedata server above, you will not be able to change this parameter.
- Password
Password to your custom live data server. If you selected Ammonit Livedata server as your Livedata server above, you will not be able to change this parameter.
- Live data sampling rate
By default, the live data is published every second, but you can choose a slower rate to reduce network usage.
- Allowed subscribers
The Ammonit Live Data Aggregator can be enabled using the checkbox. Allow more users to access the data by entering their email address in "Add new subscriber". If you would like to add an XMPP JID instead of an email address, activate "Use custom domain". This is useful for Ammonit Live Dashboard. Any users that have requested access will be shown here and can be accepted or rejected.
- Allow unrestricted data access
If you allow unrestricted data access using this checkbox, all data and configuration will be published to public nodes available to anyone. The list of allowed subscribers is ignored.
6.3. Statistics Data Files
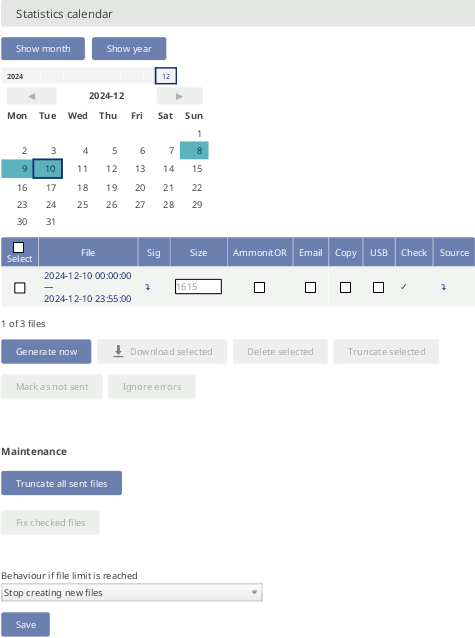
In the → menu CSV files with statistics are listed and can be downloaded. Meteo-42 shows a calendar with available statistics. Click on a month to highlight days with available CSV files. To navigate through the calendar, click on a month or use the arrows to move one month ahead or back. Click on a highlighted day to list all CSV files which have been generated for this day.
To view the available CSV files for a whole month, click on Show month; for a complete year, click on Show year. You can jump between the years and months by clicking on a month or year in the calendar.
All CSV files for the selected period are listed in a table and the file name refers to the time interval covered. For each file, a link to download the corresponding signature, its size in bytes, the methods through which the file has been shared and a link to visualize the matching source data are available. To display the source data corresponding to a file, click on the arrow in the Source column.
Below the list of CSV files it is indicated how many statistics CSV files are currently visible, from the available files in the data logger, e.g. 1 of 53 files.
If CSV files have been uploaded to an AmmonitOR project, sent per Email, copied to a configured SCP/FTP/SFTP/FTPS server, or copied onto a USB stick, they will be tagged by a checkmark in the corresponding box.
To manually download or delete one or more files, select them and click Download selected or Delete selected respectively. For the download, the CSV files will be compressed into one ZIP archive. If you want a certain file to be sent or copied again, you can also mark the selected files as not sent with the option Mark as not sent.
![[Important]](admon/important.png) | Important |
|---|---|
Deleting CSV statistics files does not delete the corresponding source data, statistics files can be generated again as long as the matching source data are still in the Source data storage. |
To immediately generate statistics files form the available source data, click on Generate now. Meteo-42 will generate new files for the configured file interval, containing a line with the calculated statistics for each statistics interval. For the standard configuration of daily file interval and ten minutes statistics interval, there will be 144 lines.
If Generate partial files is selected, not only the files for a complete file interval will be generated but also a file with the residual data until the moment of the generation. This setting is only recommended for testing purposes.
Whenever statistics files are generated they are checked for a variety of known issues. This applies for all CSV files (primary, secondary, tertiary and gust). If any checks fail, the files will be marked as possibly inconsistent with a description in the Check column. Sometimes new software releases perform new checks.
The checks include:
Invalid timestamps.
Truncated files.
Ambiguous files (duplicate header column or footer section, missing footer section or inconsistent item count).
No data.
If many files are generated at once, the new ones will have a question mark in the Check column until they have all been generated and checked.
Once the files pass the checks, the days will be shown in blue on the calendar with a tick in the Check column. Until then, they are brown.
If some files have been marked as possibly inconsistent, and the issue cannot be fixed, you can manually mark them as ok with the Ignore errors button.
Under Maintenance we provide some options for trouble-shooting in case of CSV files generation problems. Truncate all sent files will replace all existing CSV files which have already been shared by any means (AmmonitOR, Email or Remote Copy) with the text “CSV file removed via web interface” to free up memory. Show possibly inconsistent files will show all files that failed the internal consistency check. That page has a button to regenerate all such files. The Behaviour if file limit is reached option controls what happens when the system is low on storage. When there are more than 10,000 statistics files or less than 30MiB free storage remaining, the data logger stops creating new files. Changing the behaviour to automatically delete the oldest sent files will ensure that these limits are not exceeded, and files continue to be generated.
| Note |
|---|---|
Since version 2.3.6, for the periods without gust events, a file with the
content 'No gust events in this period' is generated. If Gust CSV files were generated with
versions before 2.3.5, an empty file was generated for those cases. These files will be
marked as empty ( |
Figure 6.1. Downloading Statistics
6.3.1. Configuring Statistics and CSV files
In order to configure statistics and CSV files, go to the → menu. You can define the interval over which statistics will be calculated, and which statistics are needed.
Meteo-42 automatically suggests the standard statistics for each evaluation and channel. These can be removed and additional statistics can be selected manually.
Click on Select statistics in the Configure statistics section to create the statistics, e.g. average, maximum, minimum, standard deviation, count, sum and median. Activate checkboxes to include evaluators and channels in the statistics. Remove checkboxes to exclude evaluators and channels. Additionally, Meteo-42 displays internal current and internal voltage in the CSV files.
Figure 6.2. Configuring the Statistics
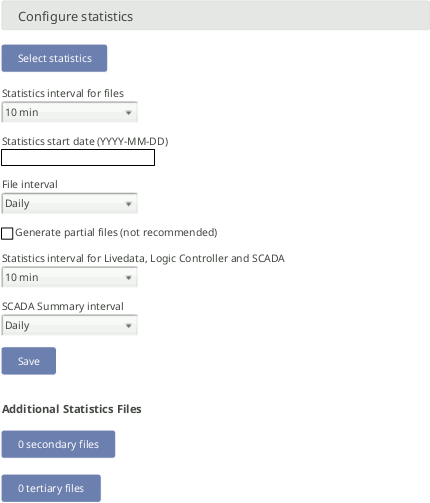
The options are:
- Select statistics
Select individual statistics for every evaluator and channel. See Section 6.3.1.1, “Statistics Selection”.
- Statistics interval for files
Defines over which time interval statistics are calculated, generating a new line in the CSV file. Several intervals are available from 1/4 s to 1 h. The same statistics interval may appear in multiple files if the recording is switched off and on again.
- File interval
Determines, how often a new aggregate data file in CSV format has to be created. Selecting Hourly, produces one file per hour that includes data from the last hour. Daily generates only one file per day, etc. Several intervals are available from every 5 minutes to weekly. The file interval is also applied to Gust data files.
- Generate partial files
Generate CSV files up to the current moment, even if the file interval has not yet finished. This means that the latest file will be incomplete and regenerated later, so it is only recommended for testing purposes.
- Statistics interval for Livedata, Logic Controller and SCADA
Defines over which time interval statistics are calculated from the live data. The calculation occurs at the end of the interval and the data are available over SCADA, applied to logic controller, sent/copied as a snapshot and uploaded to an XMPP server if configured. All current data from that period is considered to generate new aggregate data. Several intervals are available from 2 s to 1 h.
- SCADA Summary interval
Applied only to the Summary statistic of the SCADA Modbus server. Typically used to obtain a daily summary of sun status or precipitation measurements.
- Secondary Files
Suplementary statistics files can be generated with a different interval for the statistics calculation. Secondary statistics can be configured here. See Section 6.4, “Secondary and Tertiary Statistics Files”.
- Tertiary Files
A further suplementary statistics interval can be configured here. See Section 6.4, “Secondary and Tertiary Statistics Files”.
![[Warning]](admon/warning.png) | Warning |
|---|---|
Be careful with setting the statistics interval and the file interval! Low values for the statistics interval lead to huge statistics files, which you might need to remove manually once in a while. Low values for the file interval lead to many small CSV files, which might be hard to handle. |
| Note |
|---|---|
Low data file time intervals like 1, 2, 5 and 10 minutes are always delayed in generation by one or two intervals. It means that 5 minute file will always be generated with the delay of 5 or 10 minutes. I.e. 5 minute interval file that should be generated at 12:00 (containing data from 11:55 to 12:00) will be first generated at 12:05 or 12:10. |
6.3.1.1. Statistics Selection
Depending on the sensor and the evaluation type, certain statistics are preconfigured to be included in the CSV files and available for other applications like Logic Controller or SCADA. This configuration can be changed in the statistics selection menu.
Figure 6.3. Statistics Selection Page
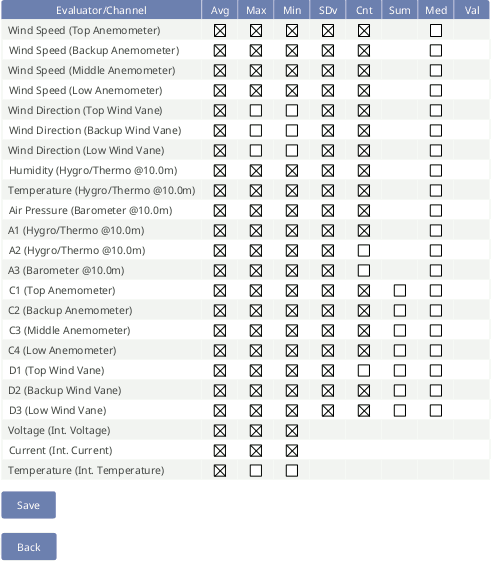
Press Save to finish the configuration of statistical values.
See Section 6.6.1.1, “Data part (CSV format)” for more information.
For solar-related evaluations Meteo-42 estimates certain values in addition to the measured values, i.e. estimated sun status and estimated direct normal irradiance. In order to create the estimated values, the location of the measurement station has to be entered in the → menu. By default the estimated values are not included in the CSV file. If required, select the values for the statistics.
Meteo-42 uses vectorial calculations for wind direction, i.e. vectorial average, direction maximum, direction minimum, and vectorial standard deviation (Yamartino method). Hence, the calculated minimum value for the wind direction can be higher than the maximum in case of wind from northern directions.
Equation 6.1. Calculation of wind direction average
The equation for the average wind direction d is given by Equation 6.1, “Calculation of wind direction average” and converted to a value between 0 and 360°.
Figure 6.4. Vectorial Calculation for the Wind Direction
6.4. Secondary and Tertiary Statistics Files
Sometimes it is necessary, to have additional statistics on top of the standard, e.g. with a different statistics interval or a different selection of values. You can activate the supplementary generation of statistics files with two different configurations. The files will be listed in a similar table as the main statistics files (see Figure 6.5, “Secondary Statistics Page” and Figure 6.6, “Tertiary Statistics Page”). If the files are generated, they will be automatically sent to AmmonitOR, Email or Remote Copy alongside the main statistics files. It is possible to disable sending the files by each of the communication methods by configuring it so in the corresponding → , → or → menu.
You can consider introducing a Start date in the secondary or tertiary statistics menu in order to generate only files after that date.
| Warning |
|---|---|
Beware that having more CSV files
|
6.4.1. Secondary Statistics Files
Select Generate additional files with secondary interval to activate the generation of the secondary files. You can configure a statistics interval different from the main statistics interval. To select the statistics which will be calculated and included in the secondary files, click on Select statistics.
Figure 6.5. Secondary Statistics Page

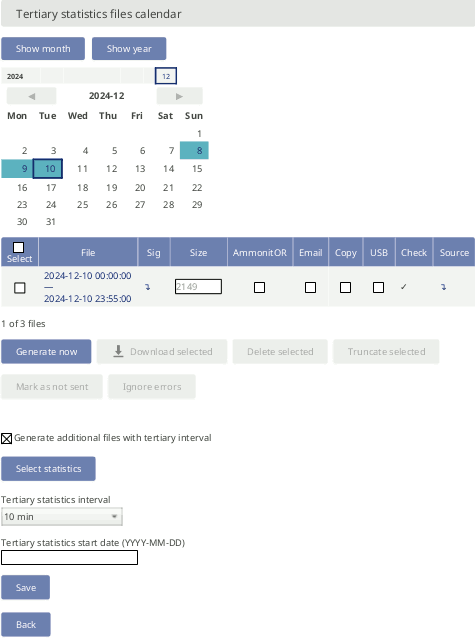
6.4.2. Tertiary Statistics Files
Select Generate additional files with tertiary interval to activate the generation of the tertiary files. You can configure an statistics interval different from the main and the secondary statistics interval. To select the statistics which will be calculated and included in the secondary files, click on Select statistics.
Figure 6.6. Tertiary Statistics Page
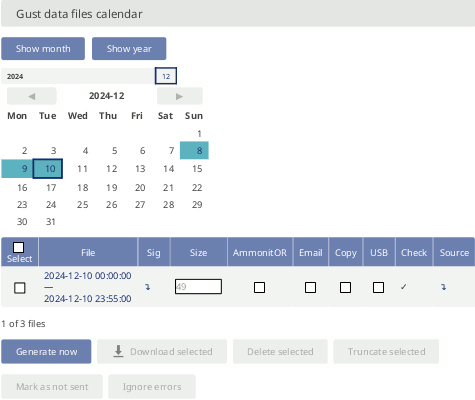
6.5. Gust Data Files
Detecting extreme wind events or gusts can be interesting to compare different geographical terrains or to estimate wind turbines load. Meteo-42 offers the possiblity to generate extra CSV files including the measurements at the maximum rate. To generate gusts data files you must activate this option in menu → .
One gusts CSV file will be generated per day (or the configured
file interval in
→ menu) including all wind gusts of that
period. If no gust was registered during the period, a file with the content No
gust events in this period is generated.
Figure 6.7. Gust Data Calendar
To be considered a gust, the selected trigger evaluation must exceed the configured threshold value a minimum number of consecutive repetitons (minimum repetitions parameter) and not more than the selected maximum repetitions. The gust as well as the previous and posterior number of seconds specified by time overhang parameter are included in the gusts CSV file.
Figure 6.8. Gust Configuration Parameters
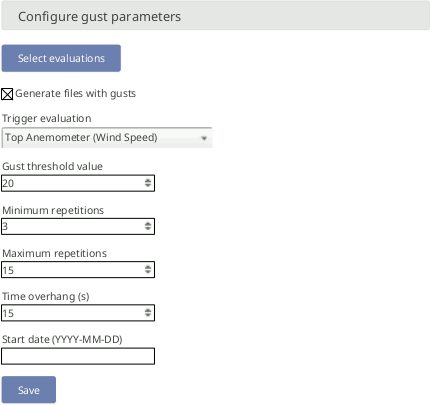
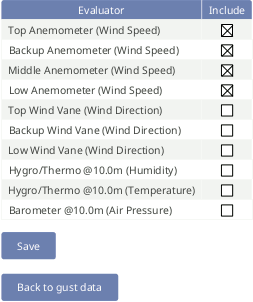
Not every existing measurement is related to gusts analysis. The relevant evaluations must be selected. Press the Select evaluations button to access the evaluations selection site and select which evaluations will be included in gusts CSV files.
Figure 6.9. Gust Evaluations Selection
| Important |
|---|---|
If the gusts data generation is activated in a running project, all existing source data will be analyzed and gusts CSV files will be generated. This process could take several hours. You can consider introducing a Start date in order to generate only files after that date. |
6.6. The CSV File Format
Meteo-42 stores measurement data in standard Comma-Separated Value (CSV) format with configuration information in ini file format. The CSV format is documented in RFC 4180 and well explained, e.g. in Wikipedia. Ini files are described, e.g. in Wikipedia as well. CSV files can easily be read by many programs and software tools, as can the ini file format. The CSV section and configuration footer are separated by a blank line.
| Note |
|---|---|
In almost all cases, the CSV files created by Meteo-42 are compressed using
GNU gzip with the typical file extension
|
6.6.1. Ammonit Meteo-42 specific details
The measurement data files of the Meteo-42 use the
, (comma) as field separator,
" (double quote) for embedding commas in textual strings and UTF-8 as
character set.
The CSV and ini parts are separated by one empty line.
6.6.1.1. Data part (CSV format)
The CSV part starts with a header line. This line is a comma-separated list of the statistics for each active channel and evaluator. The first item of the list is the date/time entry.
| Important |
|---|---|
The date and time value shows the start time of the statistics interval. |
Date and time format are similar to ISO-8601, e.g.
2014-07-17 15:50:00. The date and time
values are always the local time of the data logger. The
timezone is stated in the second part of the file.
The evaluator statistics have the form
Sensor;Evaluation;Statistic (e.g.
Anemometer;wind_speed;Avg or
WindVane10bit;wind_direction;Count). Thereafter, the channel
statistics are displayed in the form
Channel;Statistic (e.g. A2;Avg or C1;StdDev).
The statistics can individually be selected per sensor in the → menu (see Figure 6.3, “Statistics Selection Page”).
According to the configured statistics interval, Meteo-42 calculates the
statistics. Each time period is represented in a line of the CSV file. The values are
generally decimal numbers, using a point
(.) as decimal mark. The number of digits displayed
after the decimal point is automatically calculated based on the measurement precision.
For example, an anemometer with a slope of 0.0462 m/sI uses two digits
after the decimal point.
The average and standard deviation statistics include two additional digits
to reflect the additional information from repeated sampling.
Language settings of the data logger do not have an influence on the CSV file.
The following evaluation types are available:
wind_speed: Wind Speed, |
wind_direction: Wind Direction, |
humidity: Humidity, |
temperature: Temperature, |
temperature_differential: Differential Temperature, |
air_pressure: Air Pressure, |
air_density: Air Density, |
dew_point: Dew Point, |
mixing_ratio: Mixing Ratio, |
solar_ir: Solar Irradiance, |
solar_irradiance: Global Horizontal Irradiance, |
solar_irradiance_diffuse: Diffuse Horizontal Irradiance, |
solar_irradiance_diffuse_sw: Estimated Diffuse Horizontal
Irradiance, |
solar_irradiance_direct: DNI·cosθ, |
solar_DNI: Direct Normal Irradiance (DNI), |
solar_irradiance_direct_sw: Estimated DNI, |
solar_DNIcos_sw: Estimated DNI·cosθ, |
solar_irradiance_poa: POA Irradiance, |
solar_irradiance_effective: Effective Irradiance, |
sun_status: Sun Status, |
sun_status_sw: Estimated Sun Status, |
albedo: Albedo, |
uv_index: UV Index, |
precipitation: Precipitation, |
precipitation_intensity: Precipitation Intensity, |
precipitation_status: Precipitation Status, |
precipitation_sum: Precipitation Sum, |
icing_direction: Icing Direction, |
precipitation_type: Precipitation Type, |
synop: SYNOP, |
wind_speed_vert: Vertical Wind Speed, |
counter: Counter, |
time: Time, |
voltage: Voltage, |
current: Current, |
status: Status, |
power: Power, |
active_power: Active Power, |
power_factor: Power Factor, |
reactive_power: Reactive Power, |
apparent_power: Apparent Power, |
obukhov_length: Obukhov Length, |
heat_flux: Heat Flux, |
turbulence_intensity: Turbulence Intensity (TI), |
stability_parameter: Obukhov Stability Parameter (z/L), |
dir_max_speed: Direction at max. Speed, |
covariance: Covariance, |
brightness_max: Brightness max. Value, |
brightness_direction: Direction of Brightness, |
frequency: Frequency, |
inclination_angle: Angle of Inclination, |
vibration_frequency: Vibration Frequency, |
vibration_amplitude: Vibration Amplitude, |
status_word: Status Word, |
status_byte: Status Byte, |
inflow_angle: Inflow Angle, |
other: Other Evaluation, |
any: Any Evaluation, |
altitude: Altitude, |
azimuth: Azimuth, |
reference: Reference, |
wind_speed_max: Wind Speed Max, |
event_code: Event Code, |
soiling_ratio: Soiling Ratio, |
soiling_loss_index: Soiling Loss Index, |
transmission_loss: Transmission Loss, |
volumetric_water_content: Volumetric Water Content, |
electrical_conductivity: Electrical Conductivity, |
flash_level: Flash Level, |
bat_passes: Bat Passes, |
bat_pulses: Bat Pulses, |
noise: Noise, |
particulate_matter: Particulate Matter, |
meteorological_optical_range: Meteorological Optical
Range, |
duty_cycle: Duty Cycle, |
variance: Variance, |
skewness: Skewness, |
kurtosis: Kurtosis, |
volumetric_flow_rate: Volumetric Flow Rate, |
energy_flow_rate: Energy Flow Rate, |
direction: Direction |
The following statistics are available:
Avg: Average, |
Max: Maximum, |
Min: Minimum, |
StdDev: Standard deviation, |
Count: Count of valid values, |
Sum: Sum, |
Med: Median, |
Val: First valid value |
The last column of the CSV file is addr. This is the memory
address in the source data storage for the start of the interval.
6.6.1.2. Information part (Ini file format)
The information part contains data logger information as well as sensor details like installation height, slope and offset values, as well as unit and sensor name.
The information part is included in every file. It can be found below the statistical data. The overall format of the configuration is the following:
[Section 1]
key1=value
key2=value
[Section 2]
key1=value
All section names, keys and values are case-sensitive and may contain unicode characters in UTF-8 encoding. While sections and values may contain spaces; keys will not. Each section is unique; each key is unique within its section. Neither the order of sections nor the order of entries within the sections are significant or guaranteed.
[System]: Serial number in the formatserial=G123456and type of the data logger in the formattype=Meteo-42Lthe assigned name; timezone in the formattimezone=UTC+01:00(the offset can be positive or negative or be missing, which indicates UTC); the location in decimal degrees and altitude in meters:latitude=0.0 longitude=0.0 altitude=0.0as well as the software version and important system settings, e.g.cecs_power_permanent=true. Thegps_fixfield indicates the timestamp of the most recent synchronization with the satellite if GPS is used.[Summary]contains the date and time when the CSV file was created, the used source data storage, the summary over the file time interval for configured precipitation, precipitation intensity, status and sun status evaluations and total traffic for each network interface.[Evaluation]indicatesfile_intervalandstat_interval(see also Section 6.3, “Statistics Data Files”).The
file_interval, usuallydaily, can have the following values:fiveminutestenminutesfifteenminutestwentyminutesthirtyminuteshourlytwohoursthreehoursfourhourssixhourstwelvehoursdailyweeklyThe
stat_interval, usually10 min, can have the following values:1 s2 s3 s5 s10 s20 s30 s1 min2 min5 min10 min15 min20 min30 min1 h[Adjustment]:CSis the calibration value for the current source of Meteo-42. The value is for informational purpose only.[RX]: Therateof RS-485 client number X is given in s, min or h;serial_settingfor RS-485 includes speed without unit, as well as data format in conventional notation (e.g. 9600 8N1).[Sensor;Evaluator]statistic: List of statistics, which are calculated for the sensor, e.g. average, min, max.unit: Unit for the data, e.g.m/s.sensor_label: Name, which has been entered by the user in the sensor configuration.sensor_height: Installation height in meters, which has been entered by the user in the sensor configuration.sensor_type: Indicates the type of the sensor, e.g.anemometer. The following values are possible:anemometer: Anemometer,wind_vane: Wind Vane,hygro_thermo: Humidity / Temperature Sensor,barometer: Barometric Pressure Sensor,precipitation: Precipitation Sensor,pyranometer: Solar Sensor,ultrasonic: Ultrasonic Anemometer,weather_st: Weather Station,power_meter: Power Meter,soiling: Soiling Measurement,other: Other Sensorsensor_model: The model of the sensor, e.g. Thies First Class Advanced.formula: The type of formula used to convert the electrical values, e.g. linear.formula_params: Parameters, which are referenced to in the formula, including related channels and evaluator parameters, e.g.A5 A6 var_offset var_slope. Values of the parameters are displayed in the lines below the formula parameters, e.g.var_offset,var_slope,var_period,var_sensitivity.
[Channel]statistic: List of statistics, which are calculated for the channel/sensor. For each statistic a column is displayed in the upper part of the CSV file.unit: Unit of the calculated data. This is the SI unit for the type of quantity, however the unit for barometric pressure might be eitherhPaormbar, and the temperature unit is°CorKfor differential temperature.rate: Configured rate for the channel with unit (not applicable for client channels).range: Configured range for analog voltage channels (Ax) with unit.protocol: Protocol, which is used for digital channels (Dx).
6.6.2. CSV import in LibreOffice or OpenOffice
![[Tip]](admon/tip.png) | Tip |
|---|---|
Use LibreOffice Calc or OpenOffice.org Calc. These are free, professional spreadsheet programs to process your CSV files. |
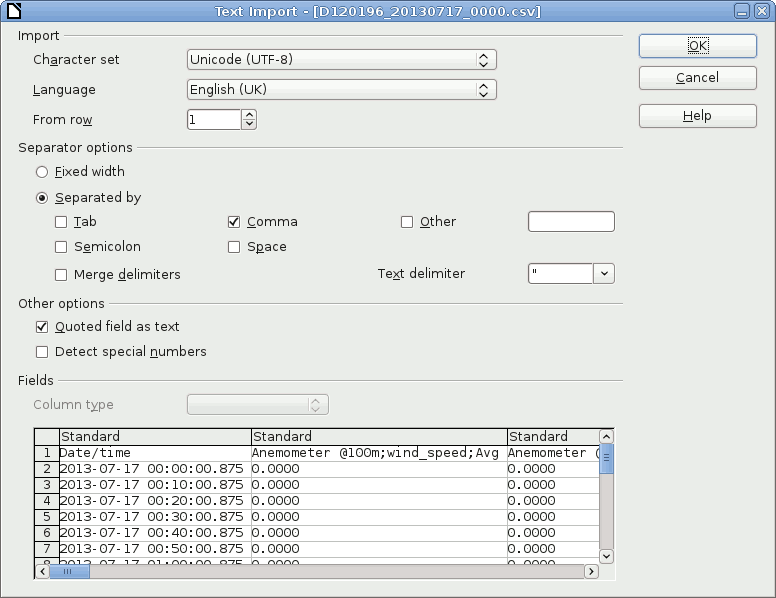
The recommended settings to import the CSV file are shown in Figure 6.10, “LibreOffice CSV-file import settings”.
Figure 6.10. LibreOffice CSV-file import settings
6.6.3. CSV Import in Microsoft Excel 2010™
Depending on the version of Microsoft Excel™ the procedure can be slightly different. In general, we recommend using the import assistant of Microsoft Excel™.
| Note |
|---|---|
Save CSV files always in a directory. The described process in Microsoft Excel™ does not work, when files are opened via your email program. |
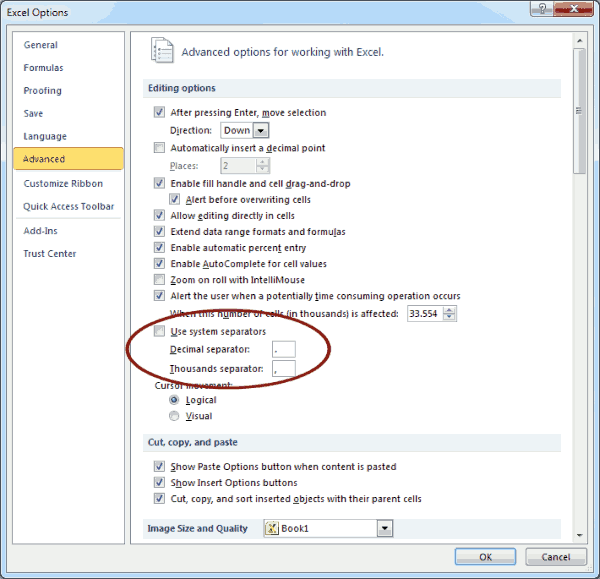
Launch Microsoft Excel™ and open the Options window, which can be found in the File menu. Open the Advanced menu. In the Editing options section deselect Use system separators and use
.(dot) as decimal separator and,(comma) as Thousands separator. See figure Figure 6.11, “ Microsoft Excel 2010™ CSV Import (1)”.Figure 6.11. Microsoft Excel 2010™ CSV Import (1)
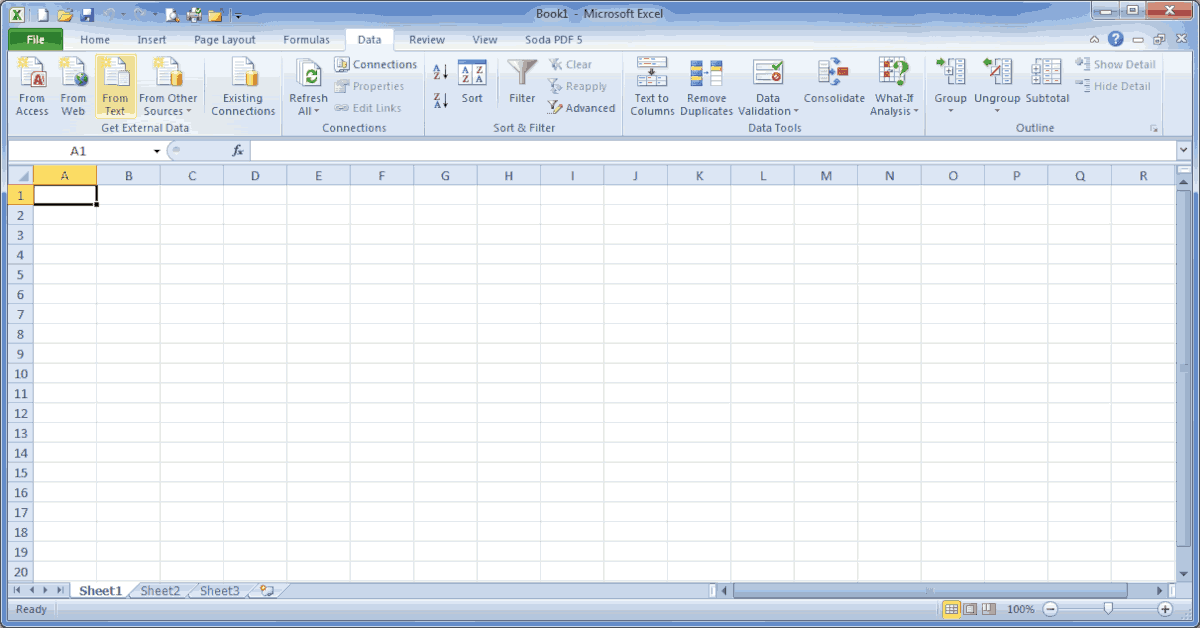
After setting the options, click on the Data tab as shown in Figure 6.12, “ Microsoft Excel 2010™ CSV Import (2)”. In order to import the CSV file, click on From Text in the group Get External Data, locate and double-click the file you want to import. Follow the instructions in the Text Import Wizard.
Figure 6.12. Microsoft Excel 2010™ CSV Import (2)
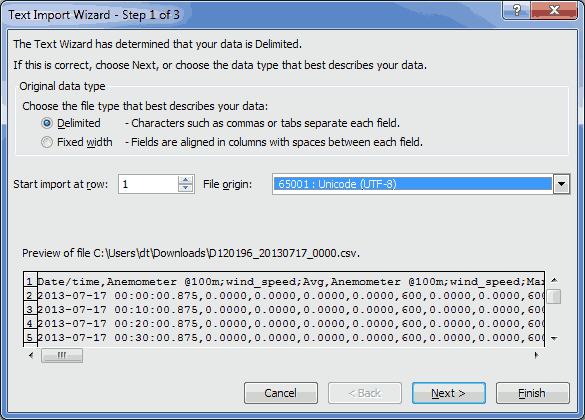
In the first step of the wizard choose Delimited as Original data type and select Unicode (UTF-8) for the file origin. See Figure 6.13, “ Microsoft Excel 2010™ CSV Import (3)”.
Figure 6.13. Microsoft Excel 2010™ CSV Import (3)
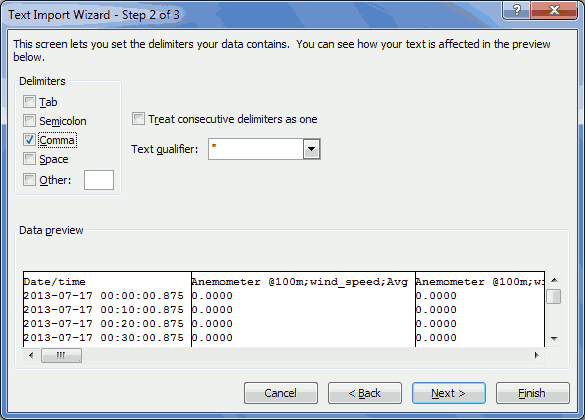
In next step define Comma as delimiter and " as text qualifier as shown in Figure 6.14, “ Microsoft Excel 2010™ CSV Import (4)”.
Figure 6.14. Microsoft Excel 2010™ CSV Import (4)
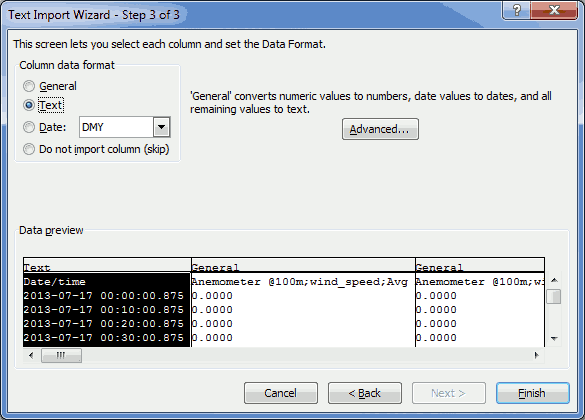
In the last step of the wizard, select Text for the data format columns. See Figure 6.15, “ Microsoft Excel 2010™ CSV Import (5)”.
Figure 6.15. Microsoft Excel 2010™ CSV Import (5)
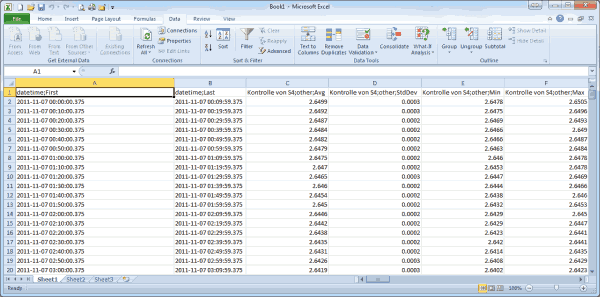
By clicking on Finish the file opens in your selected sheet. See Figure 6.16, “ Microsoft Excel 2010™ CSV Import (6)”.
Figure 6.16. Microsoft Excel 2010™ CSV Import (6)
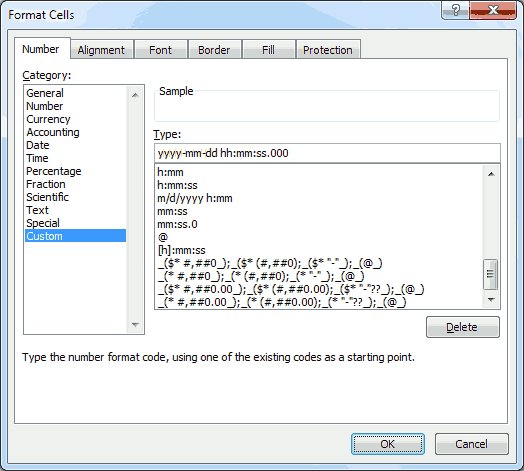
In order to change the cell format of the date and time columns from text to date time format, highlight the column(s) and open Format Cells in the Numbers group on the Home tab. Select Custom and enter YYYY-MM-DD hh:mm:ss.000 as shown in Figure 6.17, “ Microsoft Excel 2010™ Format Cells”.
Figure 6.17. Microsoft Excel 2010™ Format Cells
6.7. Access to Source Data
Source data contains all electrically measured values neither interpreted nor aggregated statistically. If source data are available and the used sensors are known, it is possible to re-evaluate a complete measurement campaign.
| Important |
|---|---|
Source data is only recorded, when recording is switched on! See the note about recording in Section 5.1, “Sensor Configuration” for details. |
The source data storage is organized as a ring buffer, which means that the oldest data will be overwritten when the storage is filled entirely. For compactness reasons data is saved in a binary format and cannot be read directly. However, you can view or download data.
To view or download source data, go to the → menu. Meteo-42 displays all months and related days, on which source data is available. As shown in Figure 6.18, “Screenshot of the Source Data Page”, select month, day and time period to display related source data in the table below.
Figure 6.18. Screenshot of the Source Data Page
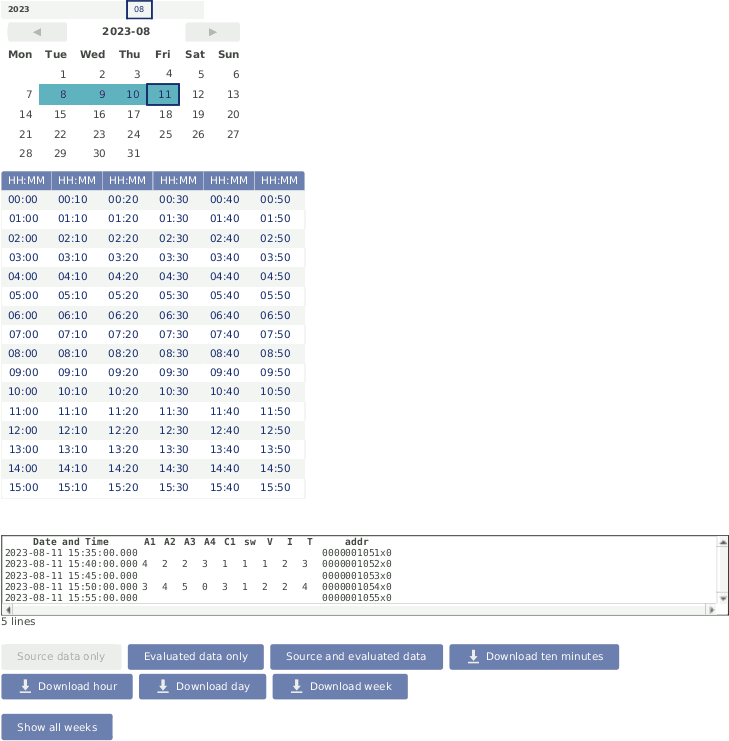
The displayed source data can be downloaded as CSV file by clicking on the buttons below the table.
- Download ten minutes
Click to download a CSV file with source data of the selected 10min-period.
- Download hour
Click to download source data of the selected hour, i.e. source data of one table row. The source data in the downloaded CSV file starts with 00:00 and ends with 59:59.
- Download day
Click to download source data of the selected day, i.e. the source data of the whole day from 00:00:00 to 23:59:59. If source data of the current day is downloaded, the CSV file includes all data up to the download moment.
- Download week
Click to download source data of the week containing selected day, i.e. Monday 00:00:00 to Sunday 23:59:59.
- Show all weeks
Open a table of every week of source data for a complete overview and easier downloading.
| Warning |
|---|---|
The volume of downloaded source data can be huge, e.g. a filled 2 GB memory can lead to a 10 GB CSV file. |