Chapter 7. Documentation
Table of Contents
In the Documentation section AmmonitOR provides a journal over all project activities, the reports over the measurement data, data logger logbook and an photo upload function.
7.1. Journal
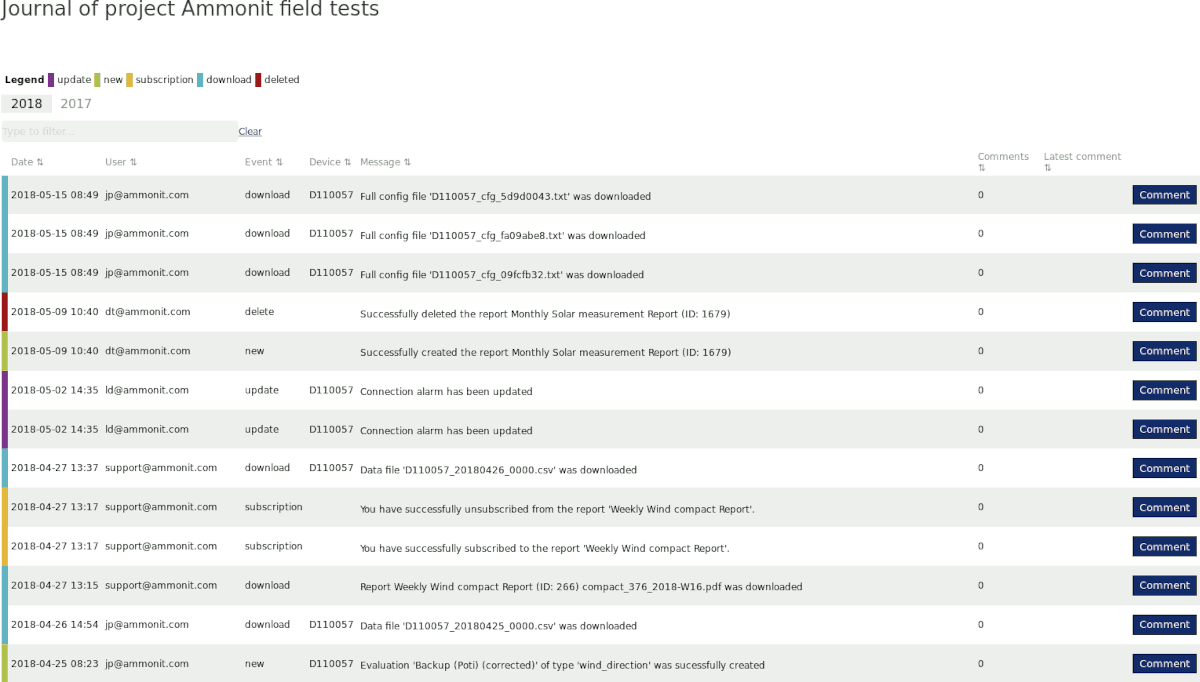
The journal is a project wide activitiy and event collector. Every event like add-a-data-logger or changes will be noted here. Downloads, uploads, subscriptions and removal of data of any kind will be listed with timstamp and the executed user. A generic search field helps to filter the list quickly.
Figure 7.1. Example of Journal for test project
7.2. Reports
AmmonitOR offers the possibility to generate PDF reports. Met mast managers can use AmmonitOR reports for monitoring purposes. Reports include information about the project, data logger(s) and the measurement as well as features to check data for plausibility and completeness.
- Report types
Wind Detailed
Wind Standard
Wind Compact
Solar Measurement
Power Curve Measurement
Or customise the report to your needs
- Available report periods
Weekly
Bi-monthly
Monthly
For power curve measurement, special reports are available. The reports for power curve measurement include calms analysis, energy yield forecasts as well as system information etc.
Users can decide to download the PDF reports via the web interface or subscribe to a report. Thus the report is sent automatically to the registered email address of the user as soon as it has been generated. If data is missing in reports due to communication issues on data logger side, the report generation will wait 2 days. Afterwards the report will be generated. Reports are available for weekly or monthly intervals.
Go to the → menu to manage your reports.
![[Important]](admon/important.png) | Important |
|---|---|
AmmonitOR reports are designed to monitor measurement and power systems. The reports can only display information, which is available and has been entered in the data logger and/or AmmonitOR, e.g., installation height, slope and offset values etc. AmmonitOR does not interpret or evaluate any data. |
7.2.1. Reports for site assessment
AmmonitOR reports are structured data logger-related, i.e., system information and measurement results are displayed data logger by data logger. The following list shows an example:
- Project Information
Project details, e.g., installed data loggers, completeness of data.
Subscribers, i.e., list of users receiving the report.
- Data Logger Dxxxxxx
Met Mast System Information
Sensors Configuration Connection Overview Supply Data Measurement Results
Time variation overview Wind Speed and wind direction Temperature Global solar irradiation Analog voltage and analog current evaluators Status evaluators
- Data Logger Dyyyyyy
Met Mast System Information
Sensors Configuration Communication Overview Supply Data Measurement Results
Time variation overview Wind Speed and wind direction Temperature Global solar irradiation Analog voltage and analog current evaluators Status evaluators
- Appendix
Links for downloading data and legal notes
Depending on the report type you have selected, the content is more compact or more detailed. Customisation of the default report types e.g. Wind Standard Report is always possible.
7.2.2. Reports for power curve measurement
Reports generated by AmmonitOR for power curve measurement are data logger-related structured, i.e., the data logger section is repeated according to the number of data loggers related to the project.
- Project Overview
Installed data loggers
Overview of data transfer and logger access
Supply data
- Data Logger Dxxxxxx
System information and configuration, i.e., data logger configuration, installed sensors and evaluations
Measurement results, i.e., a list of all evaluations including average, min and max values and its completeness rates
Time variation overview
Overlay graph
Diurnal profile
Wind power density
Calms analysis
Power curve
Site-specific energy yield
Energy yield forecast
7.2.3. Report types in AmmonitOR
AmmonitOR offers four report types: Standard, Detailed, Compact and Power Curve Measurement.
The Standard report includes tables and diagrams of all relevant measurement parameters, sensor configurations as well as a data calendar, which displays the completeness of the measurement for the selected interval (week or month). Additionally, the Standard report displays details about the measurement system, e.g., communication and supply information.
The Detailed report shows more detailed information, e.g., logbook entries and data logger configuration details.
The Compact report includes less details. It is designed for a quick met mast check.
The Solar Measurement report includes all necessary information to monitor the all the needed parameters for solar measurement.
The Power Curve Measurement report includes all necessary information to monitor the power data of a wind turbine.
| Section | Item | Wind Standard | Wind Detailed | Wind Compact | Solar | Power Curve |
|---|---|---|---|---|---|---|
| Generic | Site Information | X | X | X | X | X |
| List of Instruments | X | X | X | X | X | |
| Project Users | X | X | ||||
| Data Logger | Configuration | X | X | X | X | X |
| Evaluations | X | X | X | X | ||
| Channels | X | X | ||||
| Connection Overview | X | X | X | X | ||
| Connection Logbook - simple [a] | X | |||||
| Connection Logbook | X | X | ||||
| Internal Voltage | X | X | X | X | X | |
| Internal Current | X | X | X | X | ||
| Measurement Data Table | Wind Speed - simple [a] | X | X | X | X | |
| Wind Speed - diurnal [b] | X | X | X | |||
| Wind Direction - simple [a] | X | X | X | X | ||
| Wind Direction - all [b] | X | |||||
| Weibull Curve | X | X | X | |||
| Flow Inclination | X | |||||
| Mean Temperature | X | X | X | X | ||
| Mean Air Pressure | X | X | X | |||
| Mean Relative Humidity | X | X | X | |||
| Mean Solar Irradiance | X | X | X | |||
| Mean Turbulence | X | |||||
| Measurement Data Plots | Wind Speed | X | X | X | X | |
| Wind Direction | X | X | X | X | ||
| Weibull | X | X | X | |||
| Flow inclination | X | X | X | |||
| Temperature | X | X | X | X | X | |
| Air Pressure | X | X | X | X | ||
| Relative Humidity | X | X | X | X | ||
| Solar Irradiance | X | |||||
| Turbulence Intensity Scatter | X | X | ||||
| Turbulence Intensity Bin [c] | X | X | X | |||
| Wind Shadow Zone | X | X | X | |||
| Active Power Total | X | |||||
| Power Meter Overlay Graph | X | |||||
| Correlation Plot | Wind Speed | X | X | |||
| Wind Direction | X | X | ||||
| Temperature [d] | X | X | ||||
| Relative Humidity [d] | X | |||||
| Solar Irradiance [d] | X | |||||
| Seasonal Plot | Wind Speed [c] | X | X | |||
| Temperature [c] | X | X | ||||
| Air Pressure [c] | X | |||||
| Relative Humidity [c] | X | |||||
| Solar Irradiance [c] | X | |||||
| Diurnal Plot | Wind Speed | X | X | X | X | |
| Temperature | X | X | X | |||
| Solar Irradiance | X | |||||
| Power Output | X | |||||
| Power Curve Measurement Plots | Wind Power Density | X | ||||
| Calms Analysis | X | |||||
| Power Curve | X | |||||
| Site-specific Energy Yield | X | |||||
| Energy Yield Forecast | X | |||||
[a] Selected details with highest priority are displayed. [b] Users can download the 10min average values as CSV file, if necessary. [c] Data for at least one month has to be available. [d] At least two sensors of the same type are necessary to display this plot. | ||||||
7.2.4. Generating a new report
Go to the → menu to create a new report. Click on Create new subscription to add a new report.
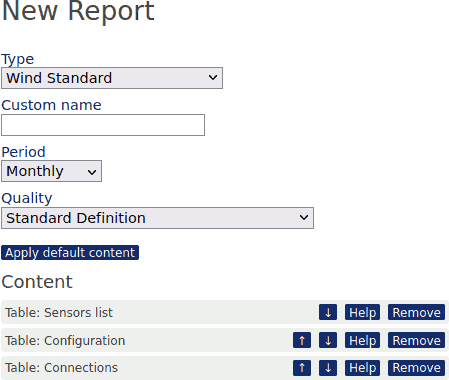
Select a report type:
Standard
Detailed
Compact
Power Curve Measurement
Optional: Type in a customised name for the report or leave it open.
... the period, for which the report should be created:
Weekly
Monthly
... and the resolution of pdf:
Standard Definition - normal quality for priting and checking the data, usually not bigger than 20MB.
High Definition - HD quality for priting the reports on bigger formats, can reach sizes up to 150MB.
Click Save to finish the report definition.
Figure 7.2. Creating a new report
 |
The user, who created the report, is automatically added to the subscriber list of the report.
Click on Details in the list of report subscriptions to display the list of generated reports. All reports are generated in the background. It may take some time until the reports are available.
As soon as a report is available, you can download the PDF file by clicking on the PDF button.
7.2.5. Customisation of reports
AmmonitOR reports can be customised no matter if a default report type was selected first or from scratch. For example if a default report type was selected, click on "Edit" and there is a list of all the content elements of the report. Further down there are more elements, who are as well available and can be added to the report.
Content elements can moved to a different position or can be removed. Available elements can be added and positioned as pleased. And if everything didn't work out as expected there is always the possibility to reset the selections to the original default report.
![[Note]](admon/note.png) | Note |
|---|---|
To move content elements use the arrow buttons Up and Down. The help button shows you more detail to the selected content element. The remove button removes the selected content elements. The "Apply default content" resets the selection and brings the default selection back. |
7.2.6. Downloading reports
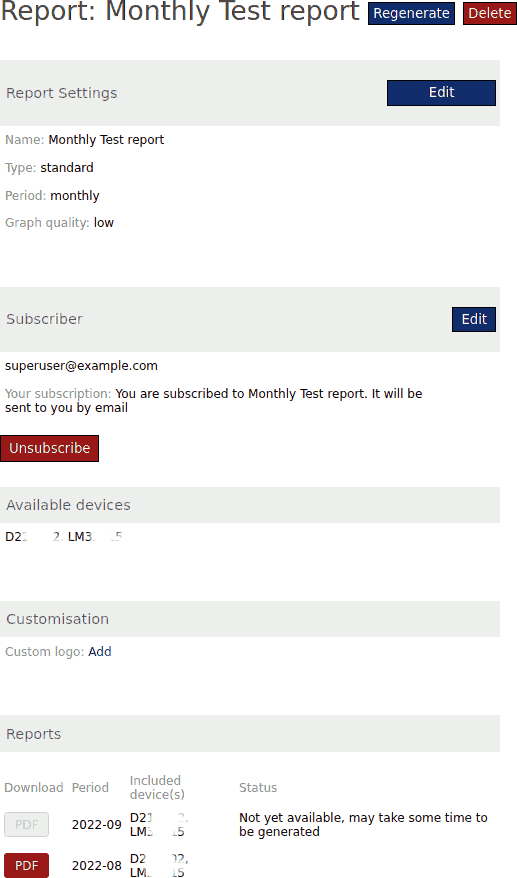
If reports have already been configured for a project, reports can be downloaded in the → menu. AmmonitOR lists the configured reports with report type and period.
Click on Details to display a list of generated reports. The latest report is listed on top. AmmonitOR shows the period for each report. By clicking on a PDF button, the report can be downloaded.
Figure 7.3. Downloading a report
 |
AmmonitOR lists all subscribers of the selected report configuration. By clicking on Subscribe your email address is added to the subscriber list.
7.2.7. Subscribing to a report
To receive a report, users have to subscribe to it. Go to the → menu for the subscription. If reports have already been configured, select a report and click on Subscribe. Your email address is automatically added to the subscriber list.
| Note |
|---|---|
Report subscriptions of project users can be managed by
|
7.2.8. Unsubscribing from a report
If you want to unsubscribe from a report, go to the → menu and select the report from which you want to unsubscribe. By clicking on the Unsubscribe button you unsubscribe from this particular report.
| Note |
|---|---|
Report subscriptions of project users can be managed by users with
|
7.3. Photos
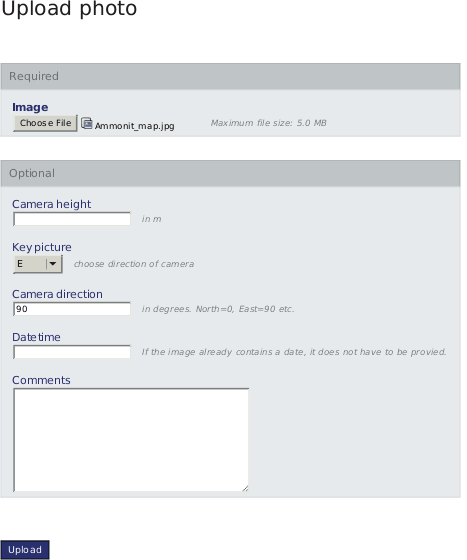
In the → menu you can view and upload pictures of data loggers, which have been assigned to the project.
Click on the Upload new photo button to add further photos. Additional information about the photo can be added, e.g., camera height, date and time.
The photos should be not larger than 5MB. Upload only GIF, JPG or PNG files.
Figure 7.4. Uploading photos to project
| Note |
|---|---|
If you upload photos other than the mentioned formats or the file is larger than 5MB, AmmonitOR will reject the file. |
The Meteo-40, Meteo-40 Plus and Meteo-42 data logger is able to send monitoring pictures in a certain interval, e.g. 1 hour. Monitoring pictures are usefull to observe sensors, e.g. to check icing grades.
7.4. Logbook
AmmonitOR displays all logbook entries of Meteo-40, Meteo-40 Plus and Meteo-42 data loggers, provided that firmware version 1.0 Rev. 13645 or higher is installed on the device. The logbook can be accessed via the → menu.
The logbook includes all logins to the Meteo-40, Meteo-40 Plus and Meteo-42 web interface and the IP address of the user as well as manually entered Meteo-40, Meteo-40 Plus and Meteo-42 logbook entries.
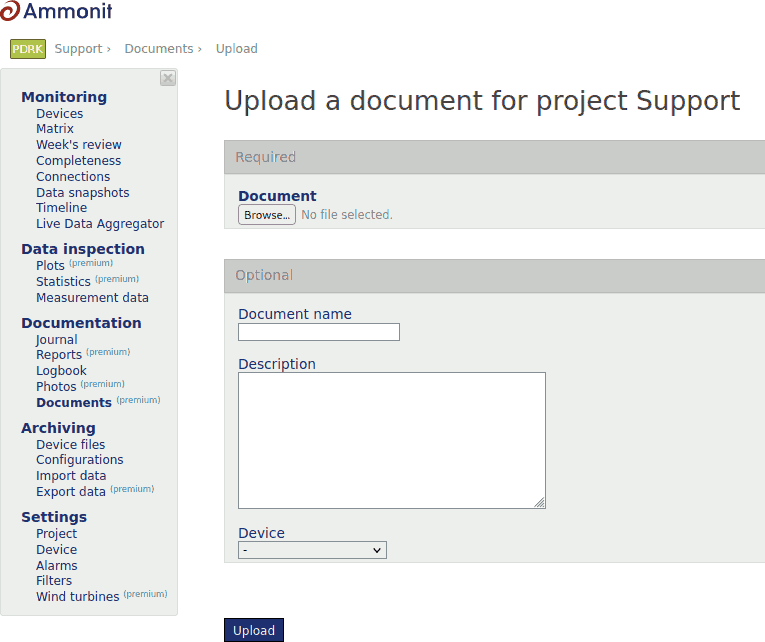
7.5. Documents
In the → menu you can upload and download any type of document related to the project, such as calibration protocols, site information, contracts etc.. Therefore you can upload in total 100MB worth of documents per project.
| Important |
|---|---|
Availabile project storage space for your documents is 100MB. Each file can't be larger than 10MB! |
Click on the Upload document button to add further documents. Optional information about the document can be added, e.g., document name, description and device.
Figure 7.5. Uploading document to project
To upload, edit and deletion of the document write permissions are necessary. To download documents download permissions are required.