Chapter 11. Channels
Table of Contents
- 11.1. Connecting Sensors to Analog Voltage Channels
- 11.2. Connecting Sensors to Counter / Period Channels
- 11.3. Connecting Sensors to Digital Channels
- 11.4. Connecting Sensors to Analog Current Channels
- 11.5. Connecting Sensors to Current Source
- 11.6. Connecting Sensors to RS-485 Client
- 11.7. Using the Switches
The previous chapter described various sensors which can be connected to Meteo-40 plus. The sensors have to be connected to the corresponding channel. Depending on the data logger type, Meteo-40 plus offers up to 35 channels. Meteo-40 plus provides connectors for the following measurands and signals:
Analog Voltage (DC)
Analog Current (DC)
Pulse Counter / Period
Digital / Serial / Status
RS-485 (client)
Furthermore, the data logger Meteo-40 plus provides up to two high precision Current Sources to supply passive sensors.
See also Section 1.3, “Meteo-40 plus Series”.
11.1. Connecting Sensors to Analog Voltage Channels
Meteo-40 plus is equipped with up to 12 differential voltage inputs, depending on the logger's type. Generally, there are two benefits from differential inputs:
Reduced impact of perturbances and interferences on the signal lines,
Helps to avoid ground loops.
You can find the analog voltage channels (Ax, Bx) on the lower left side of the measuring unit (see Section 1.2, “Overview of Meteo-40 plus”). For example, analog wind vanes, barometric pressure sensors or pyranometers with analog voltage output can be connected to analog voltage channels of Meteo-40 plus.
The analog voltage ranges comprise the following voltage ranges:
±0.1 V,
±1 V,
±10 V,
0.1 V to 0.3 V.
Note: The voltage range 0.1 V to 0.3 V is a high resolution range, especially designed for use with passive Pt1000 temperature sensors in conjunction with the current sources of Meteo-40 plus.
For further electrical details refer to Section 12.2, “Electrical Characteristics”.
Table 11.1. Analog Channels of Meteo-40 plus
| Channel | Meteo-40S | Meteo-40M | Meteo-40L | Meteo-40A |
|---|---|---|---|---|
| Analog Voltage Channels | 4 | 8 | 12 | 12 |
11.2. Connecting Sensors to Counter / Period Channels
The counter channels (C) are located next to the analog voltage channels (see Section 1.2, “Overview of Meteo-40 plus”). For example, anemometers and precipitation sensors can be connected to counter channels. For electrical details refer to Section 12.2, “Electrical Characteristics”.
With data loggers produced since 2017-06, one can use the counter channels C5, C6, C11, and C12 as period measurement channels (P). This is useful for low frequency signals. The channel names are P1 to P4, respectively.
Table 11.2. Counter / Period Channels of Meteo-40 plus
| Channel | Meteo-40S | Meteo-40M | Meteo-40L | Meteo-40A |
|---|---|---|---|---|
| Counter Channels | 4 | 8 | 12 | 2 |
| Period measurements | 0 | 2 | 4 | 0 |
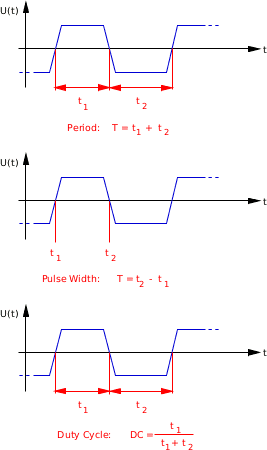
11.2.1. Period measurement
Meteo-40 plus can detect rising and falling edges of
a signal connected to P channels. Three different measurement options are implemented:
period, pulse width and duty cycle. These can be configured as
Other Sensor in the
Sensor Helper (see
Section 5.1.2, “Sensor Helper”). If you want to use the period measurement
to connect an anemometer, you must select the
Generic Anemometer PM form the list of sensors.
For the period-related measurements, the first two or three edges in the measurement interval are registered. No averaging is applied for a measurement interval.
![[Important]](admon/important.png) | Important |
|---|---|
The measurement rate must be at least twice as long as the period of the measured signal. If the measurement rate is too short, there might not be enough edges per measurement interval. |
- Period:
The Period is the duration of time of one cycle in a repeating event, so the Period is the reciprocal of the frequency. For the Period measurement, a total of three edges is needed.
- Pulse Width:
The Pulse Width or pulse duration is the time between a rising and a falling edge. At least one rising and one falling edge are needed for this measurement.
- Duty Cycle:
The Duty Cycle is the percentage of the ratio of the pulse width to the total period of the waveform. In this case, at least three edges are needed for the measurement.
Period, Pulse Width and Duty Cycle are illustraded in Figure 11.1, “Illustration of Period, Pulse Width and Duty Cycle.”.
Figure 11.1. Illustration of Period, Pulse Width and Duty Cycle.
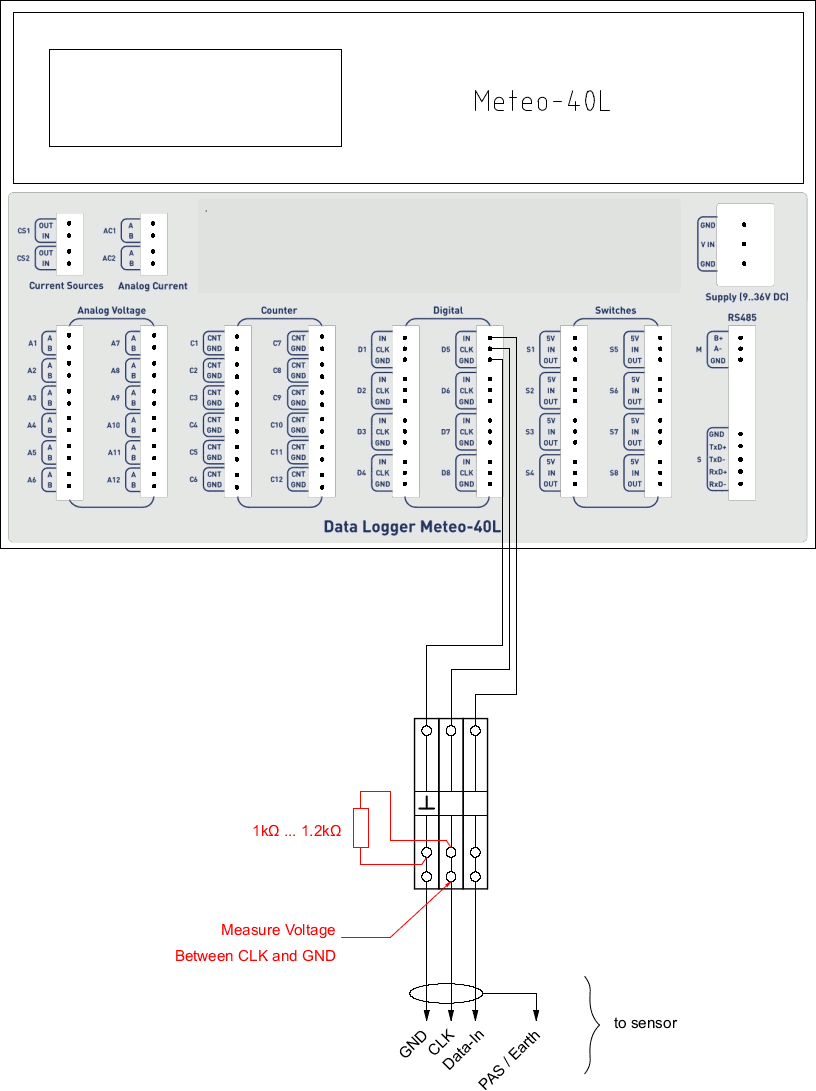
11.3. Connecting Sensors to Digital Channels
To use digital serial wind vanes Meteo-40 plus includes up to eight Digital Channels (D). These Digital Channels are located in the middle of the connection panel of the data logger. For further electrical details refer to Section 12.2, “Electrical Characteristics”.
Table 11.3. Digital Channels of Meteo-40 plus
| Channel | Meteo-40S | Meteo-40M | Meteo-40L | Meteo-40A |
|---|---|---|---|---|
| Digital Channels | 2 | 4 | 8 | 4 |
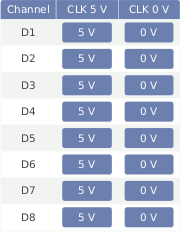
11.3.1. Functionality Check of Clock Output
To set up a proper digital connection between the sensor and Meteo-40 plus it is sometimes necessary to verify the functionality of the Digital Clock Output. The Digital Clock Output sends a short data sequence to the sensor, the sensor should respond with a data sequence on the IN line of the serial interface.
To request data from the sensor the Digital Clock Output must provide voltage levels that can be detected (understood) by the sensor. To simply test the functionality of the Digital Clock Output with a Multimeter, Meteo-40 plus provides a software driven test procedure. To perform the CLK-Line Output Test do the following:
Disconnect the sensor from the data logger.
Connect the data logger to the PC to configure it via web interface.
Login into the data logger and follow the links
→Press the "Digital test" button below the sensor list.
A tabular showing the Digital Channels available on this logger appears. The right columns of the table contain two buttons: "5 V" and "0 V" corresponding to each channel.
Figure 11.2. Configuration Menu for CLK-Line Test in Meteo-40 plus.
Connect the multi meter between CLK output and GND of the Digital Channel you intend to check.
First step: Press the button "5 V" to switch on the DC voltage of the Clock Output. There must be a voltage between 4 V and 5.6 V present at the Clock Output.
Second Step: Add a resistor of 1 kΩ–1.2 kΩ in parallel to the multi meter (see figure Figure 11.3, “Setup for CLK-Line test of Serial Interface.”). Press the button "5 V" to switch on the DC voltage of the Clock Output. The voltage at the Clock Output must not drop below 3 volts.
Notes:
The DC voltage output can be toggled between High- and Low-level via the two buttons "5 V" and "0 V"
The test has limited timespan: After pressing the "
Digital test" button and choosing the DC voltage level, the voltage level will remain only 10 seconds. To repeat the test, the button "5 V" has to be pressed again.
Test Result: If the voltage level drops below 3 volts, the CLK output of the data logger could be defective.
Figure 11.3. Setup for CLK-Line test of Serial Interface.
11.4. Connecting Sensors to Analog Current Channels
Meteo-40 plus data loggers offer analog current measurement channels: Meteo-40L and Meteo-40A provide two channels; Meteo-40M and Meteo-40S one each.
Barometric pressure sensors with current output can be connected to these channels. The current measurement channels offer current ranges of 1 mA, 10 mA and 100 mA which can be configured via web interface.
Table 11.4. Analog Current Channels of Meteo-40 plus
| Channel | Meteo-40S | Meteo-40M | Meteo-40L | Meteo-40A |
|---|---|---|---|---|
| Analog Current Channels | 1 | 1 | 2 | 2 |
11.5. Connecting Sensors to Current Source
The current source (CS) is located on the left of the communication unit next to the analog current channels (see Section 1.2, “Overview of Meteo-40 plus”). Meteo-40 plus data loggers are equipped with one or two current sources, depending on the logger's type. The goal of these current sources is to supply passive temperature sensors (PT100 or PT1000).
Single Pt100 and Pt1000 sensors as well as Pt100 sensors, which are for example implemented inside pyrheliometers can be connected to the current source of Meteo-40 plus. For electrical details refer to Section 12.2, “Electrical Characteristics”.
Table 11.5. Current Source Channels of Meteo-40 plus
| Channel | Meteo-40S | Meteo-40M | Meteo-40L | Meteo-40A |
|---|---|---|---|---|
| Current Source Channels | 1 | 1 | 2 | 2 |
![[Note]](admon/note.png) | Note |
|---|---|
For technical details and electrical characteristics of sensors, refer to the data sheets, which can be downloaded from the Ammonit website. |
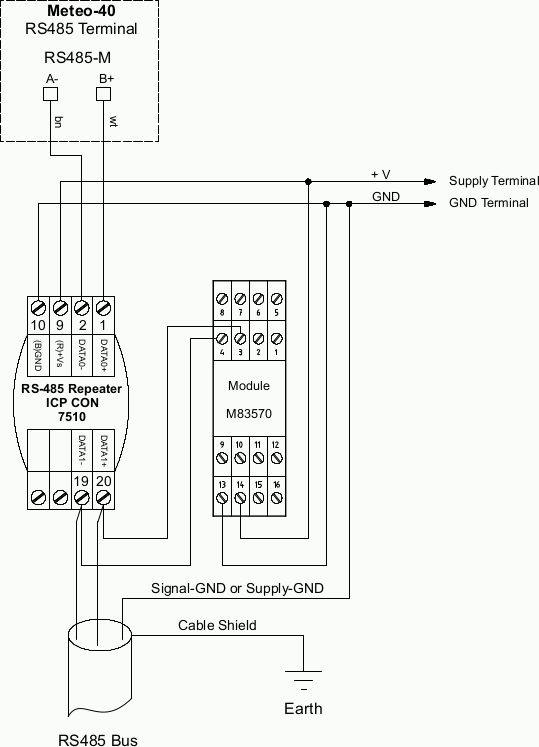
11.6. Connecting Sensors to RS-485 Client
All data logger types of Meteo-40 plus offer one RS-485 client (RS-485-M) terminals for RS-485-Bus connection of up to eight sensors with RS-485 interface. The RS-485 client of Meteo-40 is half-duplex: two connectors for Data+, Data- and Ground (GND). The RS-485 client interface of Meteo-40 plus does not provide galvanic separation. For this reason we recommend to use an additional repeater that provides sufficient isolation when cable length of the RS-485-Bus is above than 30 meters. The figure below depicts an example setup with isolation repeater and biasing module M83570 (both available from Ammonit Measurement GmbH).
For further electrical details refer to Section 12.2, “Electrical Characteristics”.
Figure 11.4. Electrical Connection Plan: RS-485 client terminals of Meteo-40 plus
11.6.1. Configuring RS-485 Sensors
When adding an RS-485 sensor in the Sensor Helper, a (selectable) channel name between RxC1 and RxC8 is automatically assigned to the sensor. Subindexes, e.g. R1C1_1, R1C1_2, are created for measured data and evaluations. In the → menu the evaluations are displayed. Both measured values and evaluated data are included in the CSV files and can be seen in the → menu.
Most RS-485 sensors have to be preconfigured before use, e.g. serial settings and device identifier. The same settings must be applied at the Sensor Helper, when adding the sensors to be requested from the Meteo-40 plus.
| Important |
|---|---|
If you intend to connect more than one sensor to an RS-485 client port, all connected sensors must use the same protocol and serial settings. Additionally, each sensor needs a unique ID (RS-485 address), which must be preconfigured at the sensor. It is possible to perform different requests to the same RS-485 sensor, by configuring two sensors with the same sensor ID. The transmission mode for all RS-485-connected sensors must be half duplex. See Section 11.6, “Connecting Sensors to RS-485 Client”. |
The time allocated to a sensor depends on the number of sensors configured and the measurement period. The sensor request, the response delay and the response transmission itself should happen within this interval. Otherwise the response telegram will not be fully read and an RS-485_TELEGRAM_ERROR will appear in the Measurement and Recording Errors (see Section 4.9, “Using the Logbook”).
The response telegram will be recorded at the end of this interval, this implies a delay between sensor response and recording. The maximum delay is 1 s.
If more than one sensor is configured and the measurement period is 1 s, the time must be shared between the sensors. The minimum dedicated time per sensor is 125 ms.
Measurement intervals between 1 s and 1 h can be selected. If only one RS-485 sensor is configured, shorter measurement intervals are available: 1/2 s, 1/4 s, 1/4 s and 1/8 s.
Available baud rates: 38400, 19200 and 9600 bits per second.
Available serial settings (data/parity/stop): 8N1, 8N2, 8E1.
11.6.2. SDI-12 sensors
SDI-12 is a standard communications protocol which provides a means to transfer measurements taken by an intelligent sensor to a data recorder. A subset of the SDI-12 protocol is implemented on Meteo-40 plus. By means of an external hardware, an RS-485 client interface can be used to connect SDI-12 sensors. If more than one SDI-12 is connected, the external adapters must be configured with different RS-485 addresses. The supported SDI-12 sensors can be found in section Sensors.
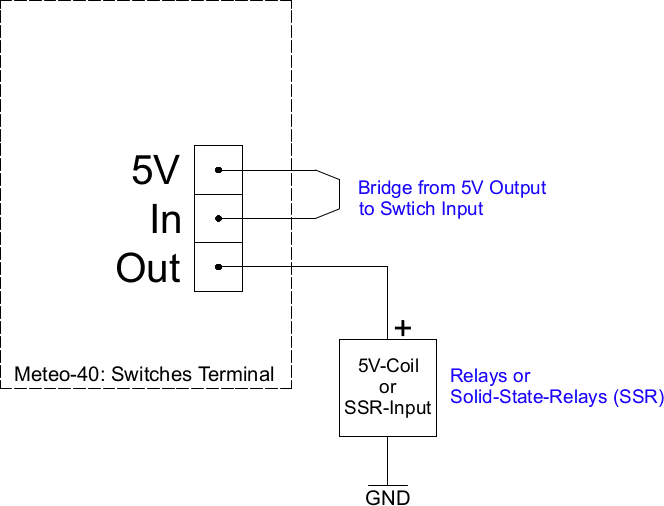
11.7. Using the Switches
Each Meteo-40 plus data logger includes switches to switch different kinds of loads on and off. The number of switches depends on the type of the logger (S, M, L, or A). The switch is internally realized with a P-channel MOSFET. The loads can be sensors as well as relays (electro-mechanical or solid state). Each switches section consists of three terminals: 5 V output, Input (In) and Output (Out).
Input terminal: This is the input of the voltage to be switched. Note: Input voltage must be positive with respect to ground (GND).
Output terminal: Output of the switch.
5 V Output terminal: The 5 V output can be used as a control voltage for external devices. Load current must be below 50 mA. The 5 V output is always available, it is not toggled with the switch. Furthermore, it can be used as input voltage for the switches.
The following two figures show example circuits to make clear the use of the 5 V and the switches terminals.
Figure 11.5. Use switches to supply sensors.
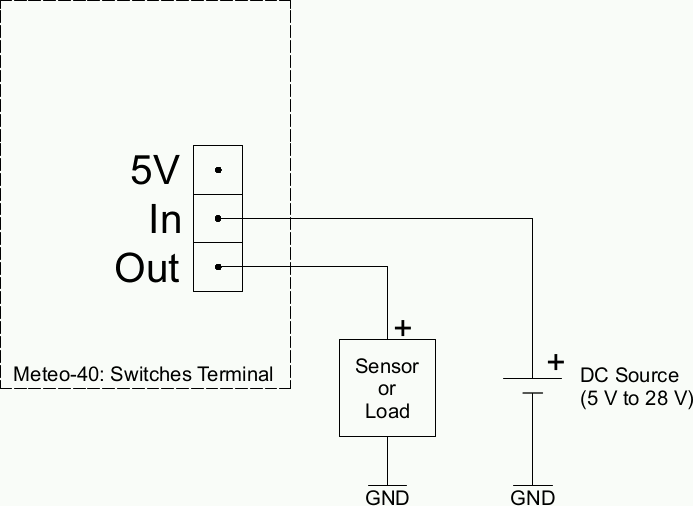
Figure 11.6. Use switches and 5 V to control external loads.