Chapter 10. Ammonit Meteo-40, Meteo-40 Plus and Meteo-42 data loggers
Table of Contents
10.1. Preparing Meteo-40, Meteo-40 Plus and Meteo-42 for AmmonitOR
AmmonitOR version 5.5.6 and higher is compatible with Meteo-40, Meteo-40 Plus and Meteo-42 data loggers. If you use a previous version on your server, perform an upgrade or contact Ammonit.
To display measurement data and/or communication behaviour of Meteo-40, Meteo-40 Plus and Meteo-42 data loggers in AmmonitOR, the data logger and AmmonitOR have to be configured.
If the data logger should be added to an existing AmmonitOR project, note down the Project key of the existing project. If the data logger should be included in a new project, set up a new project in AmmonitOR and note down the Project key. The Project key has to be entered in the → menu of the Meteo-40 web interface as shown in Figure 10.1, “Configuring the Meteo-40 web interface”. See also respective Meteo device manuals, which can be downloaded from the Ammonit website.
Figure 10.1. Configuring the Meteo-40 web interface
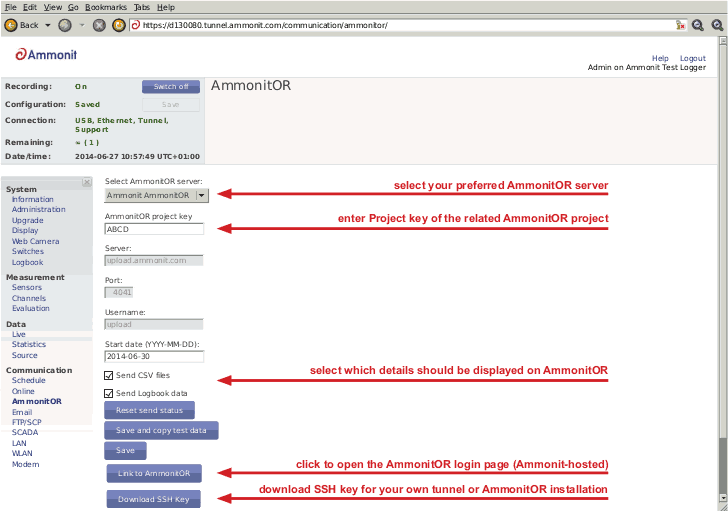
Select your preferred AmmonitOR server: Ammonit-hosted installation or your own AmmonitOR server.
If you use the Ammonit-hosted installation, server details are filled automatically. If you use your own installation, enter the necessary server details. Your local AmmonitOR server has to authenticate each data logger. To do so, see Section 14.4.1, “Adding Meteo devices SSH Keys”.
- AmmonitOR project key
Enter the Project key of your related AmmonitOR project. The Project key is displayed in the project overview of your AmmonitOR project. You can connect more than one data logger to an AmmonitOR project. To do so, use the Project key for all project-related data loggers.
Decide, which data should be monitored in AmmonitOR:
- Both Measurement Data and Communication Behaviour (default)
Select both checkboxes Send CSV files and Send Logbook data to monitor measurement data and communication behaviour of the data logger.
- Only Measurement Data
Select Send CSV files to monitor measurement data, resp. statistic data in AmmonitOR. According to the scheduled upload times, Meteo-40, Meteo-40 Plus and Meteo-42 sends CSV files to AmmonitOR. Deselect Send Logbook data.
- Only Communication Data
Select Send Logbook data to monitor the communication behaviour of the data logger. According to the scheduled upload times, Meteo-40, Meteo-40 Plus and Meteo-42 transfers connection details to AmmonitOR - no measurement data is uploaded, when only the checkbox Send Logbook data is ticked. Send CSV files has to be unticked.
The communication behaviour can be monitored in the Connection Log (see Section 5.5, “Connections”).
- Link to AmmonitOR
Click on Link to AmmonitOR to enter the AmmonitOR login page or to set up a new AmmonitOR account.
- Download SSH Key
Applies only, when you use a local AmmonitOR installation (not the Ammonit-hosted installation). Your AmmonitOR server has to authenticate each Meteo-40, Meteo-40 Plus and Meteo-42 data logger. To do so, download the SSH key and see Section 14.4.1, “Adding Meteo devices SSH Keys”.
10.2. CSV Files
Meteo-40, Meteo-40 Plus and Meteo-42 stores measurement data in standard Comma-Separated Value (CSV) format with appended information in ini file format. The CSV file is documented in RFC 4180 and well explained, e.g., in Wikipedia. Ini files are described e.g. in Wikipedia as well. CSV files can easily be read by many programs and software tools, as is the ini file format.
![[Note]](admon/note.png)
10.3. Meteo CSV File Format
The measurement data files of the Meteo-40, Meteo-40 Plus and Meteo-42 use the , (comma) as field separator, "(double quote) for embedding commas in textual strings and UTF-8 as character set.
The statistics files generated by Meteo-40, Meteo-40 Plus and Meteo-42 data loggers are structured in two parts, the data in standard CSV format and additional information in so-called ini file format. Both parts are separated by one empty line:
10.3.1. Data part (CSV format)
The CSV part starts with a header line. This line is a comma-separated list of the
statistics for each active channel and evaluator. The first item of the list is the
data/time entry; followed by the evaluator statistics which have the form
Sensor;Evaluation;Statistic (e.g., Anemometer;wind_speed;Avg or
WindVane10bit;wind_direction;Count).Thereafter, the channel statistics are displayed in
the form
Channel;Statistic (e.g., A2;Avg or C1;StdDev).
The statistics can individually be selected per sensor in the → menu.
Currently, Meteo-40, Meteo-40 Plus and Meteo-42 offers the following statistics: Avg, Min, Max, StdDev, Count, Median, Sum and Value.
According to the configured statistics interval, Meteo-40, Meteo-40 Plus and Meteo-42 calculates the statistics. Each time period is represented in a line of the CSV file. The values are generally decimal numbers, using a point (.) as decimal mark.
Language settings of the data logger do not have an influence on the CSV file. In
the first column of the CSV file the datetime for each statistic is given. Date and time
are indicated with milliseconds in accordance to ISO-8601, e.g.,
2012-05-31 15:50:00.500.
The date and time values are always the local time of the data logger. The timezone is stated in the second part of the file.
10.3.2. Information part (Ini file format)
The information part contains data logger information as well as sensor details like installation height, slope and offset values, as well as unit and sensor name.
The information part is included in every file. It can be found below the statistical data. The overall format of the configuration is the following:
[Section 1] key1=value key2=value [Section 2] key1=value
All section names, keys and values are case-sensitive and may contain unicode characters in UTF-8 encoding. While sections and values may contain spaces; keys do not. Each section is unique; each key is unique within its section. Neither the order of sections nor the order of entries within the sections are significant or guaranteed.
[System]: Serial number and type of the data logger; the name which has been assigned by the user; timezone in the format UTC+xx:xx or UTC-xx:xx; as well as the version of the firmware of the data logger[Evaluation]indicates file_interval and stat_interval.[Adjustment]:CS1,CS2andVS1are the calibration values for the current source of Meteo-40, Meteo-40 Plus and Meteo-42. The values are for informational purpose only.[Counters]: Themeasurement_periodfor counter channels is indicated in seconds, in general 1s. For this time period the number of pulses is counted.[Master]:rateof RS485 is given in s, min or h;baudratefor RS485 without unit.[Sensor;Evaluator]statistic: List of statistics which are calculated for the sensor, e.g., average, min, max.unit: Unit for the data, e.g.,m/s.sensor_label: Name which has been entered by the user in the sensor configuration.sensor_height: Installation height which has been entered by the user in the sensor configuration.sensor_type: Indicates the type of the sensor, e.g., anemometer.sensor_model: The model of the sensor, e.g., Thies First Class Advanced.formula: The type of formula used to convert the electrical values, e.g., linear.formula_params: Parameters which are referenced to in the formula, including related channels and evaluator parameters, e.g.,A5 A6 var_offset var_slope. Values of the parameters are displayed in the lines below the formula parameters, e.g., var_offset, var_slope, var_period, var_sensitivity.
[Channel]statistic: List of statistics which are calculated for the channel/sensor. For each statistic a column is displayed in the upper part of the CSV file.unit: Unit of the calculated data.rate: Configured rate for the channel with unit (not applicable for Master channels).range: Configured range for analog voltage channels (Ax) with unit.protocol: Protocol which is used for digital channels (Dx).