Chapter 9. Settings
Table of Contents
In the Settings section you can set up the project and the data loggers. Additionally filters can be defined, connection alarms and power curves can be added.
9.1. Project Information
9.1.1. Project details
After going to
→ , AmmonitOR displays the most important project details. Details can be
modified by clicking on
Edit next to the project name.
Edit is not visible for users with
Viewer or
Guest access rights.
Figure 9.1. Project detail
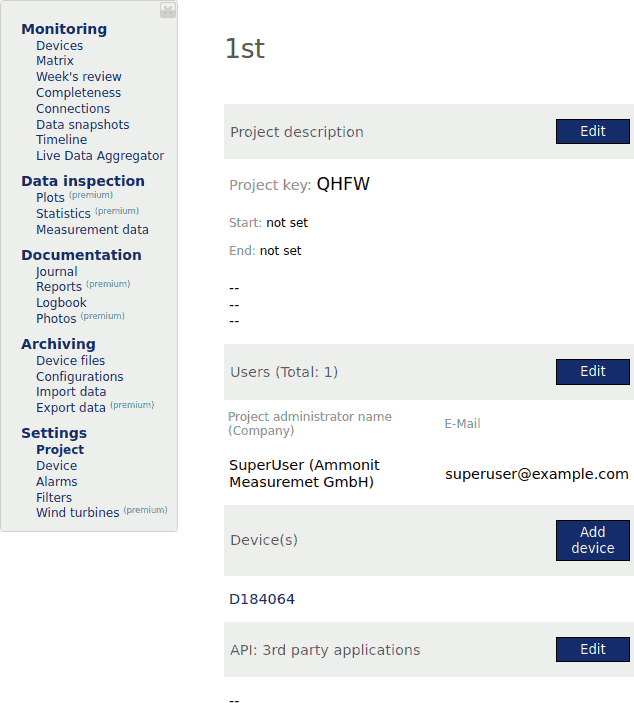 |
- Project key
Unique code assigned to all project-related Meteo data loggers
The Project key is also mentioned in the URL of the project.
- Comment
Text entered in the comment field, when creating a project. The comment can be modified by clicking on the Edit button in the Project discription block.
![[Note]](admon/note.png)
Note The Edit button is not visible for users with
ViewerorGuestaccess rights.- Users
Number of users registered for this project. Click on Edit to display and modify user information; further users can be invited. For everyone visible are users with admin permissions to the project. Contact them if you need further information or permissions to a project.
Note The Edit button is not visible for users with
ViewerorGuestpermissions.- Device(s)
List of all project-related devices with their serial number. Devices can be added, clicking the Add device button.
Click on the serial number to see device's details.
- API: 3rd party applications
List of 3rd party applications, who have access via REST-API. Click the Edit button to manage 3rd party access. Also see further descriptions how to use the REST-API correctly with AmmonitOR in Section 14.6, “API for 3rd party applications”.
Projects in AmmonitOR can have two different states: Active or Finished. Click on Edit next to the project name to change the state of the project.
9.1.2. Setting up a new project
In order to start your measurement campaign in AmmonitOR, a project has to be
created. Click on
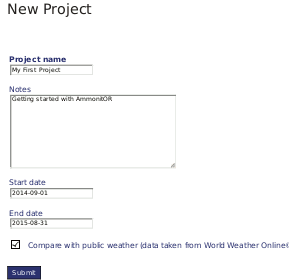
New Project in the navigation menu and enter
Project Name and optional
Notes and press
Submit.
Project Name and
Notes can be modified later.
By setting a Start date and an End date the project period can be limited. Thus test periods before the actual project start are not analysed for example. Use the DIN format to enter the date, i.e. YYYY-MM-DD (2014-05-31).
| Note |
|---|---|
The End date does not set the Project state to finished. |
Figure 9.2. Creating a new project
After submitting the project, a new page is displayed and a
Project key has been generated (see
Section 9.1.2.1, “Project key”).
![[Important]](admon/important.png) | Important |
|---|---|
The
|
The new project is created and the configuration can start. For changing general project settings click on the Edit button next to the project name; for deleting the project, click on Delete.
The user, who created the project, automatically becomes the owner of the project
and has full access rights (
Admin rights). Other users can be invited to the project by clicking
on the
Edit button next to the users headline. For further details see
Chapter 4, User management.
9.1.2.1. Project key
The
Project key is used to control the communication between AmmonitOR
and Meteo-40, Meteo-40 Plus, Meteo-42 and MeteoLaser devices. It is not necessary for
Meteo-32 data loggers. Each project has its own unique key. The
Project key is also displayed in the URL of the project.
The
Project key is very important for all AmmonitOR projects with
Meteo-40, Meteo-40 Plus, Meteo-42 and MeteoLaser devices. Enter the
Project key in the web interface of your Meteo-40, Meteo-40 Plus and
Meteo-42 data logger (
→ ) to upload files to your AmmonitOR account or to display the tunnel
connections. If you use more than one Meteo-40, Meteo-40 Plus or Meteo-42 data loggers
in the same project, the
Project key has to be entered for all assigned Meteo-40 data
loggers.
| Note |
|---|---|
If you use an AmmonitOR installation on your server, it has to be configured differently from the AmmonitOR installation on the Ammonit server. Refer to the respective Meteo-40, Meteo-40 Plus and Meteo-42 manual, which can be downloaded from www.ammonit.com or consult the Meteo-40 online help in the web interface. |
9.1.3. Uploading data to a project
To view measurement data, at least one data logger has to be assigned to a project. Depending on the data logger type, AmmonitOR offers several methods to add data loggers resp. upload measurement data. Some data loggers have different import condition depending on device type and/or statistic interfals of the data file. For more information about upload and import mechanics in Section 8.3, “Import Data”.
Uploading CSV files via SCP connection from Meteo-40, Meteo-40 Plus, Meteo-42 and MeteoLaser devices (see Section 9.1.3.1, “Meteo-40, Meteo-40 Plus and Meteo-42: Automatic data upload via SCP connection ”)
Emailing data files from Meteo-32 devices
Uploading CSV files via FTP connection from Zephir300 devices (see Section 9.1.3.7, “Zephir300: Automatic data upload via FTP connection”)
Manually import data from Meteo-40, Meteo-40 Plus, Meteo-42, MeteoLaser, Meteo-32, AQ510 and Zephir300 devices (see Section 9.1.3.2, “Meteo-40, Meteo-40 Plus, Meteo-42 and MeteoLaser: Manual import of CSV files ”, Section 9.1.3.4, “Meteo-32: Manual data upload” and Section 9.1.3.5, “AQ510: Manual data upload”)
| Note |
|---|---|
Measurement data aggregated by Meteo-40, Meteo-40 Plus, Meteo-42, MeteoLaser and Zephir300 data loggers is saved in CSV files. Each CSV file includes statistical data, sensor and data logger details. For further details see Section 10.2, “CSV Files”. Measurement data aggregated by Meteo-32 data loggers is saved in ROW files. Each ROW file includes the statistical data for the configured channels as well as the serial number of the data logger. ROW files do not include any information about sensors. Additionally, Meteo-32 generates an ROWINFO file, which contains slope and offset values as well as channel information. The ROWINFO file has to be uploaded to AmmonitOR as well. For further details see Section 11.2, “ROW and ROWINFO files”. Measurement data aggregated by other devices vary between the formats. Campbell creates the files the DAT format, AQ510 in the TXT format. Only these file formats can be uploaded to AmmonitOR for these devices. |
9.1.3.1. Meteo-40, Meteo-40 Plus and Meteo-42: Automatic data upload via SCP connection
For the automatic data upload, an AmmonitOR project key is required, which has to be entered in the Meteo-40 web interface. Go to the → menu and enter the project key in the appropriate field. The checkbox Send CSV files has to be selected to upload measurement data to AmmonitOR. The checkbox is selected by default.
If you use an AmmonitOR installation on your server, select Custom server in the → menu of your Meteo-40, Meteo-40 Plus and Meteo-42 web interface, enter the project key and your server details.
Test the connection from Meteo-40, Meteo-40 Plus and Meteo-42 to AmmonitOR in the device web interface. A green line in the Connections overview indicates the successful upload.
According to the communication schedule, which is configured in the → menu of the Meteo-40, Meteo-40 Plus and Meteo-42 web interface, CSV files will be uploaded to AmmonitOR. No further interaction is needed. The CSV file includes measurement data as well as details about the data logger and all configured sensors. All details are imported automatically in AmmonitOR.
After the first data upload has been performed, data logger(s), sensor details and statistical data are displayed in AmmonitOR.
| Note |
|---|---|
Meteo-40 records, which CSV file has been uploaded. In the
→ menu all CSV files, which have already been transmitted to AmmonitOR,
have a check mark in the column
|
| Important |
|---|---|
At scheduled upload times Meteo-40, Meteo-40 Plus and Meteo-42 transfers all CSV files, which have been generated since the last upload. If it is the first upload, device transfers all CSV files to AmmonitOR - no matter how many CSV files have been generated. |
| Important |
|---|---|
Imported data expires after 2,5 years. The original data files stay on the file system and can be re-imported if needed. See for more information Section 8.3, “Import Data” |
9.1.3.2. Meteo-40, Meteo-40 Plus, Meteo-42 and MeteoLaser: Manual import of CSV files
If you decide not to upload data automatically or data should be displayed immediately, you can import CSV files manually. To do so, a data logger has to be added to your project. Click on Add data logger in the project overview (menu: → ). Enter the required details and finish with Add data logger.
Figure 9.3. Adding a new Meteo-40 data logger
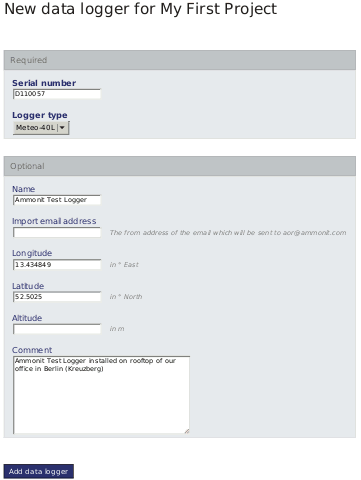
The newly added data logger is displayed in the project. By clicking either on the data logger image, its name or serial number, data logger details can be modified. In order to view sensor details and measurement data, CSV files have to be uploaded. Go to the → menu and select data logger as well as CSV files (Data files), which should be uploaded.
| Note |
|---|---|
Measurement data aggregated by Meteo-40, Meteo-40 Plus and Meteo-42 data loggers is saved in CSV files. Each CSV file includes statistical data, sensor details. For further details refer to Section 10.3, “Meteo CSV File Format”. |
| Important |
|---|---|
If the data logger type entered in AmmonitOR does not match with the data logger type according to the CSV file, AmmonitOR will reject the CSV file. |
After importing the files, AmmonitOR displays further details of your project, e.g., data logger details, data calendar, sensors and evaluations.
Figure 9.4. Logger details for Meteo-40
| Important |
|---|---|
Imported data expires after 2,5 years. The original data files stay on the file system and can be re-imported if needed. See for more information Section 8.3, “Import Data” |
9.1.3.3. Meteo-32: Emailing measurement data to AmmonitOR
If your Meteo-32 data logger should automatically send emails with measurement data to AmmonitOR, AmmonitOR and your data logger have to be configured. To receive data files, the data logger has to be added to the appropriate project. To do so, click on Add data logger in the project overview and enter the required Meteo-32 data logger details. Finish the configuration with Add data logger (see also Section 9.1.3.4, “Meteo-32: Manual data upload”).
Download and install Ammonit CALLaLOG software and refer to Chapter 11, Ammonit Data Logger Meteo-32 to configure your Meteo-32 data logger.
| Important |
|---|---|
Meteo-32 data import are restricted. For more information see restricted data import account managment Chapter 3, Restricted data import management) |
9.1.3.4. Meteo-32: Manual data upload
In order to upload data manually, a Meteo-32 data logger has to be added to a project. Click on Add data logger in the project overview and enter the required details.
| Important |
|---|---|
Meteo-32 data import are restricted. For more information see restricted data import account managment Chapter 3, Restricted data import management) |
Figure 9.5. Adding a new Meteo-32 data logger
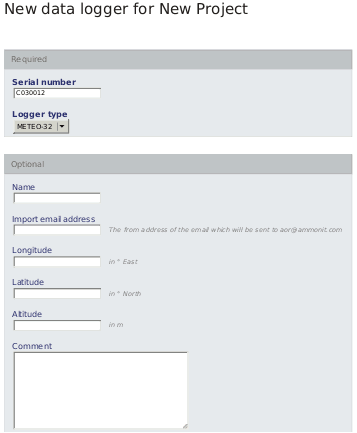
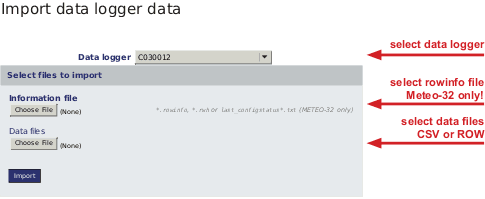
The added Meteo-32 data logger is displayed in the project overview. In order to display measurement data, files have to be uploaded. To do so, go to the → menu, select the appropriate data logger and browse on your computer for .rowinfo (information file) and .row (data) files. Upload the .rowinfo file in the Information file box; the .row files in the Data files box. Click on Import to upload the selected files.
Figure 9.6. Manual upload of Meteo-32 data
| Important |
|---|---|
If the data logger type entered in AmmonitOR does not match with the data logger type according to the ROW file, AmmonitOR will reject the CSV file. |
After importing the files AmmonitOR displays further details of your project, e.g., data logger details, data calendar and evaluations.
9.1.3.5. AQ510: Manual data upload
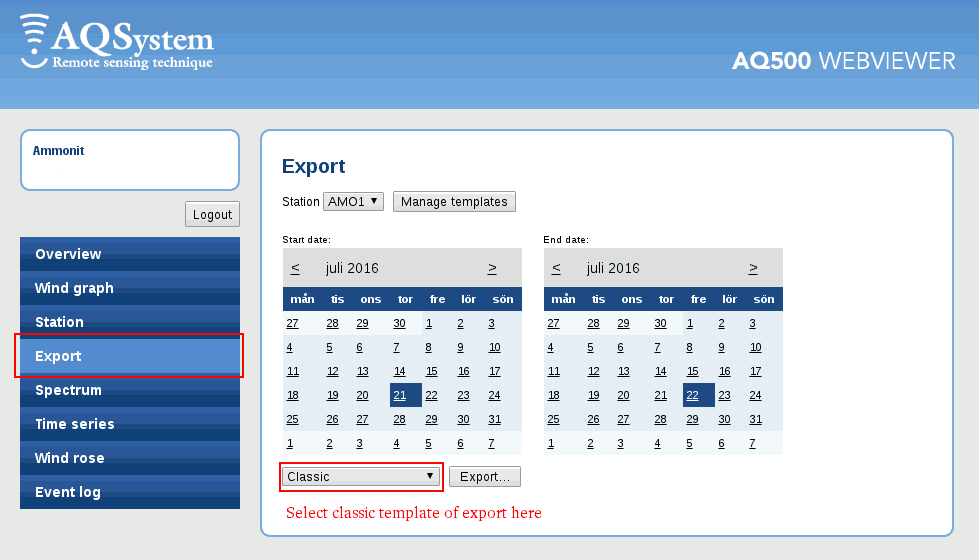
AQ510 data files can be uploaded to AmmonitOR manually through data import tab in AmmonitOR menu. AmmonitOR is compatible with the "Classic" format of an AQ510 data file. The files in this format can be downloaded while having an account in AQSystems webviewer. The "Classic" format can be then exported in tab export.
| Important |
|---|---|
AQ510 data import are restricted. For more information see restricted data import account managment Chapter 3, Restricted data import management) |
Figure 9.7. AQSystems webviewer "Classic" format export
9.1.3.6. Campbell: Manual data upload
Campbell data files can be uploaded to AmmonitOR manually through data import tab in AmmonitOR menu. AmmonitOR is compatible with the "TOA5" format of Campbell data files.
Campbell gives very flexible possibility of setting up how the output file would look like. AmmonitOR requires a certain structure and can be configured via a parser configuration tool.
The AmmonitOR parser configuration can be found on the data logger detail page. The section "Campbell Parser Config" is highlited orange, if not configured.
First how does a typicall TOA5 looks like? In the following list the general structure of TOA5 formatted data file is explained:
Data file: Frist header row is the configuration section.
It can contain following elemets:
The device serial as a number, i.e. "17910"
The Campbell model, i.e. "CR1000",
The software version i.e. "CR1000.Std.31",
And a system name i.e. "MyCampbellLogger".
Example how the first header row can looks like: "TOA5","17910","CR1000","17910","CR1000.Std.31","","","MyCampbellLogger"
Second header row:
"TIMESTAMP", "RECORD", scan_count_Max", follwed by series of comma separeted evaluation names, sensor heights in meters and evaluation types, enclosed in a word of certain format: "label_height_type".
Example of second header row:
"MyEvaluation_12m_Temperature",""TIMESTAMP", "RECORD", scan_count_Max","YourEvaluation_100m_Pressure" for evaluation with label MyEvaluation, at the height of 12 meters and of temperature type and YourEvaluation, at the height of 100 meters and of pressure type.
Please use sign _ between the evaluation elements. Also, please note, that the height needs to be followed by m. 12 meters should be written as 12m. Empty spaces are not supported, so refrain from names with spaces between them.
Third header row contains: ""TS","RN",""" followed by series of comma separated units.
Example of third row: "TS","RN","","%","W/m2".
Fourth header row contains: "","","Max" followed by Series of comma separated statistics.
Example of fourth row: "","","Max","Min","Min".
The number of columns in rows second to fourth must be equal and represent the columns and their number in the data table that will follow them.
Further rows should contain the data for each timestamp, separated by comma, in columns respecive to the evaluation they relate to.
To parse and import the data file, what was received by Campbell data logger, properly, AmmonitOR needs to have key information, such as:
| Important |
|---|---|
Serial number: AmmonitOR needs to parse the serial number correctly otherwise the data file can not be seen as related to that specific data logger and will be marked as invalid. In that case the data will be not impported! To tell AmmonitOR where to find the serial number within the first header row, please set up a parser config. |
How to setup a parser config properly?
Time range (Date from, Date to):
As standard leave the fields Date from and Date to empty, that means this config will cover the full time span of your data. If your file formatting changed over time, it might be necessary to set different parser configs for the related time spans. If you need more than one parser config for your campagne, please make sure that they do not overlap timewise.
Intervals (File Interval, Entry Interval):
If you use a standard setup with 10min averages, the default values of Entry Interval such as File Interval don't need to be touched.
Positions:
The position define, where AmmonitOR can find the information for e.g. serial, name, software version and station number. Those are defined in the first row of the header of TOA5 file. Please make sure that the positioning is correct!
Evaluation map: To use the full feature set of AmmonitOR it is necessary to assign the evaluations correctly to their type.
Example:
- A column name in header of TOA5 file: "Anemometer1_80m_Avg"
- Type of evaluation: "wind_speed"
- Click add evaluation (down below) and type in the name of the evaluation (identifier): "Anemometer1"
- Select the correct evaluation type (Drop down menu): "Wind Speed"
- Save
IMPORTANT: The statistic affix e.g. "Avg", "Min", "Max" etc. can be ignored and should not be part of the identifier.
In the evaluation map form field, you can type in your naming pattern to make sure, that AmmonitOR parser assigns the evaluation type correctly. The parser checks the column name in the data file and looks for a substring named in evaluation map. If the substring can't be found, nothing happens. If the substring is multiple times available, all unique identifiers are assigned to the defined evaluation type. If you don't configure evaluations map, all evaluations are assigned to "Other" evaluation type. If you forgot to add an evaluation name to evaluation map, this evaluation's type will be mapped to "Other". If a substring is in evaluation map defined, what can't be found in the data file, nothing happens.
| Important |
|---|---|
Campbell data import are restricted. For more information see restricted data import account managment Chapter 3, Restricted data import management) |
| Note |
|---|---|
If you have more than one Campbell device sending data files to AmmonitOR, it might be handy to copy the one parser config to all the other Campbell data logger instances on AmmonitOR. Just go to the parser config list of your device and click on the copy button. A list with all the other Campbell devices appear, who you have access to. |
9.1.3.7. Zephir300: Automatic data upload via FTP connection
| Note |
|---|---|
If you need to upload your Zephir300 10 minute averaged CSV files manually, you can follow the instructions for the Meteo-40 manual data upload (see Section 9.1.3.2, “Meteo-40, Meteo-40 Plus, Meteo-42 and MeteoLaser: Manual import of CSV files ”). |
| Important |
|---|---|
Zephir data import are restricted. For more information see restricted data import account managment Chapter 3, Restricted data import management) |
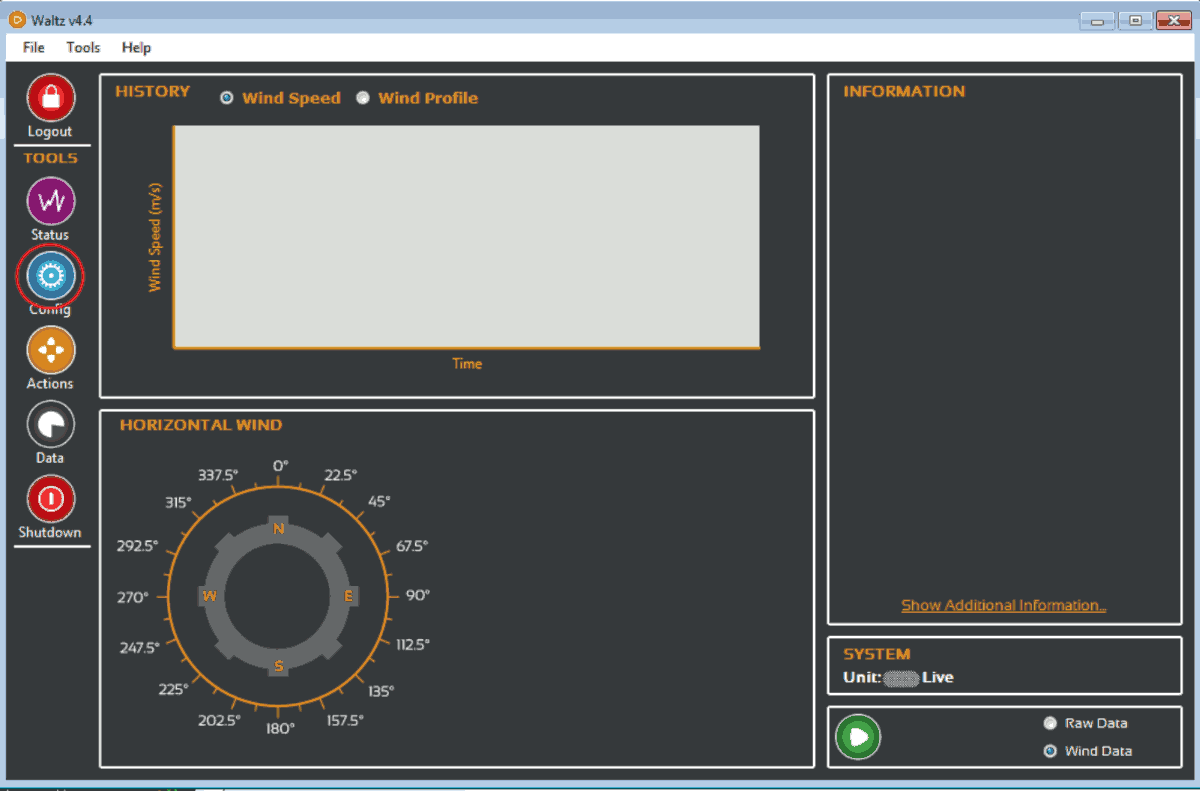
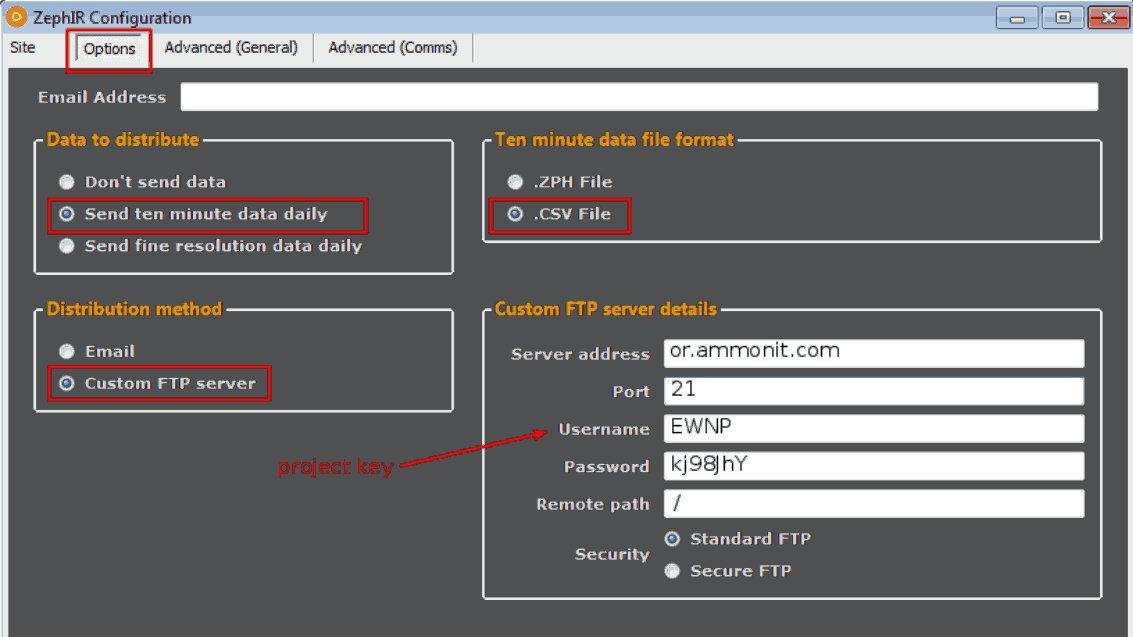
For the automatic data upload, an AmmonitOR project key is required, which has to be entered as FTP username in the Waltz web interface. Connect with your Zephir and go to Config. In the tab Options, select Custom FTP server as shown in the screenshot.
Figure 9.8. Main live menu of Waltz
 |
The fields in Custom FTP server details should be filled as below
- Server address:
Fill in "or.ammonit.com" or, if you have an own AmmonitOR server, your custom server address.
- Port:
Port is "21" by default. If you have an own server, ask your System Administrator.
- Username:
The username should be the project key you defined in your AmmonitOR project.
- Password:
The password is provided by us. Use the manual for Zephir FTP data import to learn how to get one.
- Remote path:
The remote path has to be "/". Compare the screenshot.
- Standard FTP or Secure FTP:
For the AmmonitOR FTP service, always use standard FTP.
| Important |
|---|---|
Make sure that you choose the 10 minute averaged data and CSV format. Otherwise AmmonitOR wont accept the data. |
Figure 9.9. How to navigate to FTP server settings in the Zephir live view.
 |
As soon as you saved the configuration for the zephir, your 10 minute averaged data files will be sent to AmmonitOR automatically and can be viewed in the respective project.
9.1.4. Deleting projects
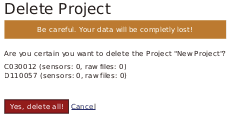
In order to delete a project, you have to open it and click on the Delete button next to the project name. Before the project will be deleted, AmmonitOR displays a warning message, which has to be confirmed ( Yes, delete all!).
Figure 9.10. Deleting a project
| Important |
|---|---|
After deleting a project, the data cannot be recovered! In case of doubt, keep the project. |
Only users with
Admin rights are allowed to delete projects.
9.2. Data Logger Information
9.2.1. List of data loggers
Instead of listing projects, all data loggers implemented in your projects can be listed by clicking on List all data loggers in the left navigation of the Project List page. AmmonitOR displays for each data logger a box with data logger serial number, name and type. Additionally, 24h averages of temperature and wind speed as well as 24h minimum internal voltage of the data logger are shown. Put your mouse pointer on the value to display the corresponding sensor for temperature and wind speed. For each data logger, AmmonitOR displays total completeness and when the last data has been imported.
Click on the data logger, to view details of the data logger, e.g., related project and active sensors. For further details see Section 9.2, “Data Logger Information”.
| Note |
|---|---|
If a data logger is used in more than one project, it will be displayed multiply. |
For listing data loggers related to a project, select a project and go to the → menu. AmmonitOR shows only the data loggers related to this particular project. As mentioned above, AmmonitOR indicates additional details for the data logger, i.e., total completeness and minimum internal voltage.
Figure 9.11. List of project related data loggers
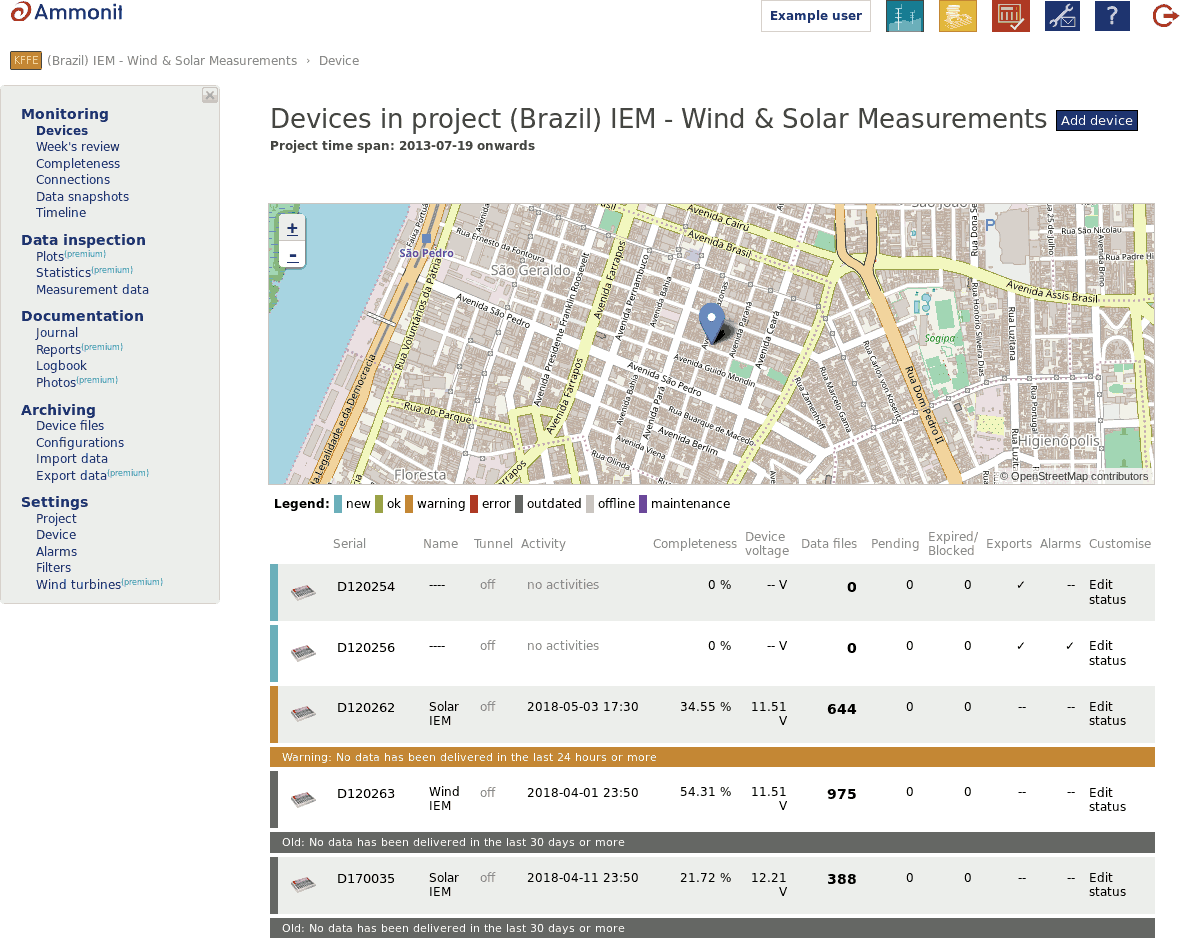 |
The data loggers are sorted by serial number in ascending order.
See also Section 9.2, “Data Logger Information”.
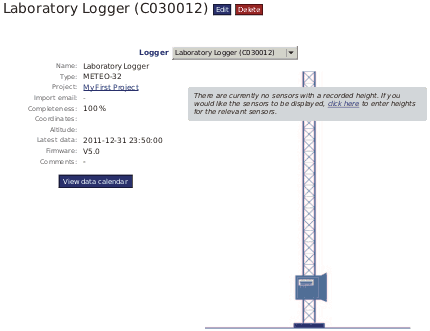
9.2.2. Data logger details (Overview)
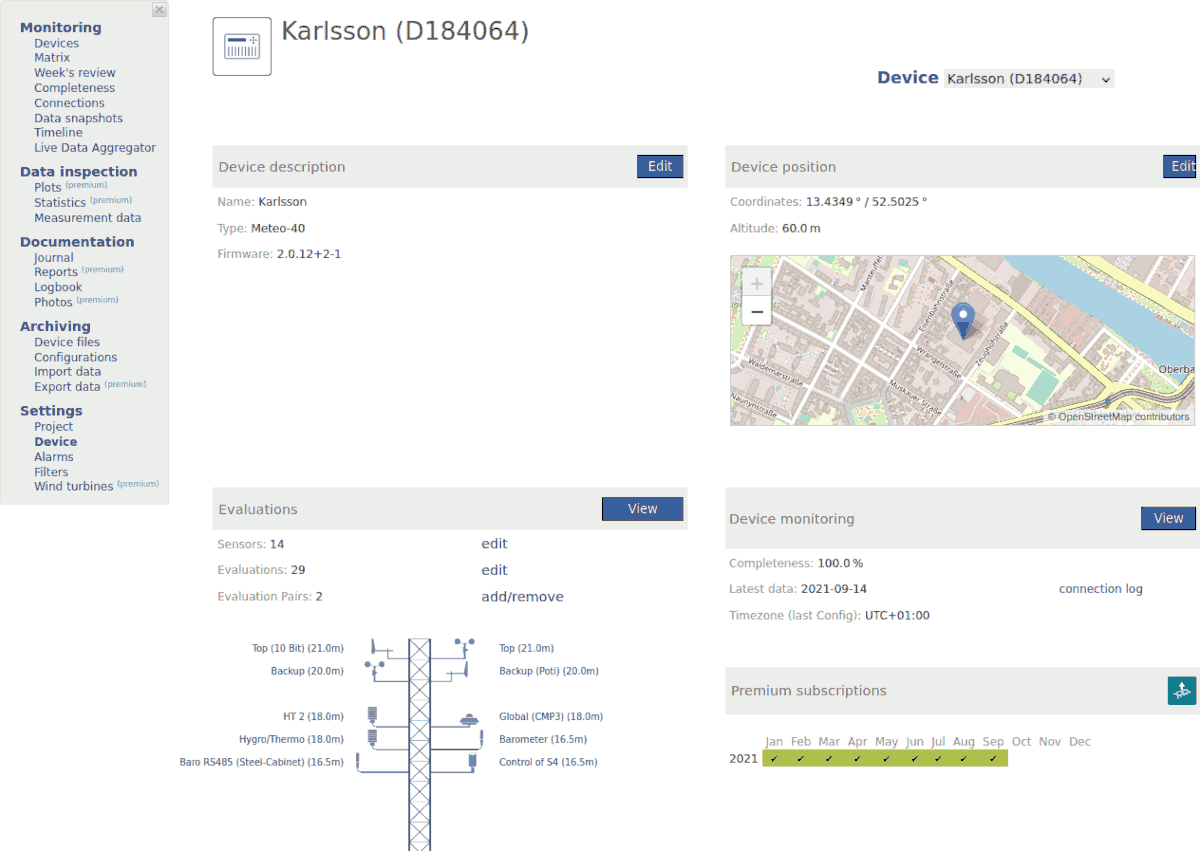
In order to view details of a data logger, click on it in the data logger list (see Section 9.2.1, “List of data loggers”) or on its serial number resp. on the data logger picture in the project overview (see Section 9.1.1, “Project details”).
Figure 9.12. Data logger details
- Name
For Meteo-40, Meteo-40 Plus, Meteo-42 data loggers, AmmonitOR displays the name entered in the Meteo-40 web interface. Click on Edit to modify the name in AmmonitOR. The name can also be changed by clicking on the Edit button in the data logger box of the project overview.
If there are different names used for the data logger in the Meteo-40, Meteo-40 Plus and Meteo-42 web interface and in AmmonitOR, the name entered in AmmonitOR has priority.
The data files of Meteo-32 data logger do not include a data logger name. So the data logger name can be added or modified only in AmmonitOR.
- Type
The data logger type is automatically set, when CSV files from Meteo-40, Meteo-40 Plus and Meteo-42 data loggers are uploaded according to the schedule in the device web interface.
If data loggers are added manually, the data logger type has to be selected from a dropdown list. For Meteo-32 data loggers, the type has to be set manually.
The data logger type must correspond to the uploaded data files. If the data files do not correspond with the added data logger type, AmmonitOR will reject the uploaded data files.
- Project
Name of the project (measurement campaign), to which the data logger is related.
- Import email (only displayed for Meteo-32 data loggers)
Indicates the email address used by the Meteo-32 data logger to email data files to AmmonitOR.
- Completeness
AmmonitOR checks how many entries are expected to be in the system and compares the value with the actual number of entries. The completeness is displayed as percentage.
- Coordinates
Data logger GPS coordinates can be entered in the data logger description. Coordinates entered in the Meteo-40, Meteo-40 Plus and Meteo-42 web interface are not imported in AmmonitOR.
- Altitude
The altitude of the data logger position can be edit in the data logger description. Altitudes entered in the Meteo-40, Meteo-40 Plus and Meteo-42 web interface are not imported in AmmonitOR.
- Latest data
Indicates the timestamp of the last imported data set; data format: yyyy-mm-dd hh:mm:ss
- Firmware
Indicates the firmware version installed on the data logger, which is included in the uploaded CSV (Meteo-40, Meteo-40 Plus, Meteo-42, Meteo-Laser, Zephir300), ROW (Meteo-32), TXT (AQ510) and DAT (Campbell) file.
- Comments
Individual text, which can be added in the data logger description. Click on Edit to modify the comment.
- Evaluation pairs
Indicates the number of defined evaluation pairs. Click on add/remove to modify the settings. Evaluation pairs are important for several calculations, e.g., power curve measurement.
Note Some authorities, e.g., Turkish meteorological institution, demand evaluation pairs in their measurement guidelines. Evaluation pairs refer to related measurands like wind speed and wind direction. The data considered for evaluation pairs should be collected from sensors, which are installed on similar heights; the max. distance is often indicated in the guidelines.
In order to modify name and other data logger details, click on
Edit in the data logger overview or in the data logger box in the
project overview.
Edit is not visible for users with
Viewer or
Guest rights.
In order to check the data for completeness, click on View data calendar. For more details about the data calendar go to Section 5.4, “Completeness Calendar”.
By clicking on View connection log, AmmonitOR displays the communication behaviour of Meteo-40, Meteo-40 Plus, Meteo-42 and MeteoLaser devices. This feature has to be configured in the Meteo-40 web interface. Refer to Section 5.5, “Connections” for more details about the connection log.
After data files have been imported, AmmonitOR displays a mast drawing with all sensors connected to the data logger. For Meteo-40, Meteo-40 Plus and Meteo-42 data loggers AmmonitOR displays label and installation height (if available) of the installed sensors. Remote devices like MeteoLaser, Zephir300 and AQ510 will have their respective evaluations drawn on the drawing indicating the measuring height. For other devices the mast drawing has to be configured - sensor labels and installation height are not included in the data files.
In addition to the mast drawing, AmmonitOR displays a table with sensor label, type, installation height and evaluation. Refer to Section 9.2.4, “Sensors” and Section 9.2.5, “Evaluations” for further details about the content of the table.
9.2.3. Deleting data loggers
In order to delete a data logger, you have to go to data logger overview and click on Delete next to the data logger name. Before the data logger will be deleted, AmmonitOR displays a warning message, which has to be confirmed (Yes, delete!)
| Important |
|---|---|
After deleting a data logger, the data cannot be recovered! In case of doubt, keep the data logger. |
Only users with write access rights are allowed to delete data loggers.
9.2.4. Sensors
Additionally, AmmonitOR shows a table with configured sensors and evaluations. For further details see Section 9.2.4.1, “Sensors with Meteo-40, Meteo-40 Plus and Meteo-42 data loggers” and Section 9.2.4.2, “Sensors with Meteo-32 data loggers”.
If sensor details should be modified, click on Edit sensors, which is displayed below the table. Sensor label, type and installation height can be modified and saved in one step. Via Full details sensor details including evaluations are displayed and further evaluations can be configured.
Figure 9.13. Sensors connected to a data logger
By clicking on List all evaluations, AmmonitOR displays a list of all available evaluations, e.g., wind speed, wind direction, humidity etc.
Figure 9.14. Evaluations recorded by the data logger
For further details about Evaluations go to Section 9.2.5, “Evaluations”.
9.2.4.1. Sensors with Meteo-40, Meteo-40 Plus and Meteo-42 data loggers
CSV files generated by Meteo-40, Meteo-40 Plus and Meteo-42 include sensor details configured in the device web interface, e.g., label, installation height as well as slope and offset values. According to this configuration, AmmonitOR displays the measurement system (simplified drawing) and shows sensor labels and installation heights.
Click on the sensor in the drawing or in the table to display further details and evaluations. AmmonitOR displays for each sensor evaluation(s) including unit, formula and channel (source).
Click on an evaluation to display an XY plot showing the behaviour of the evaluation over the last 7 days. Additionally, AmmonitOR lists the configuration history and any configuration overrides. See also Section 9.2.5, “Evaluations”.
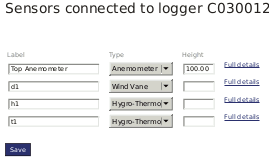
9.2.4.2. Sensors with Meteo-32 data loggers
Since sensor details cannot be configured in the CALLaLOG software, which is necessary for working with Meteo-32 data loggers, AmmonitOR cannot display a drawing of the measurement system based on the files sent to AmmonitOR. In addition to the met mast drawing, AmmonitOR lists all sensors and evaluations in a table.
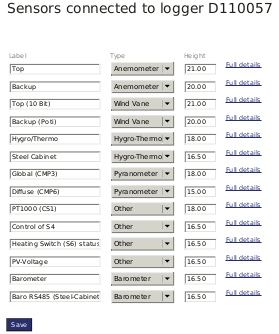
In order to view the measurement system, it has to be configured. Click on the "empty" image (see Figure 9.15, “Drawing of a measurement system (Meteo-32)”) to start the configuration.
Figure 9.15. Drawing of a measurement system (Meteo-32)
AmmonitOR displays a table, which includes all channels according to the ROW file. Sensor label, type and installation height can be assigned. Press Save to finish the configuration. In order to see further sensor details and evaluations, click on Full details.
In order to display details of the evaluation, click on an evaluation listed in the table below the met mast drawing. Click on List all evaluations to show all available evaluations of the measurement system.
By clicking on an evaluation a XY plot is displayed, which shows the behaviour of the evaluation over the last 7 days. Additionally, AmmonitOR lists the configuration history and any configuration overrides. See also Section 9.2.5, “Evaluations”.
Figure 9.16. Configuring a measurement system (Meteo-32)
![[Tip]](admon/tip.png) | Tip |
|---|---|
We recommend configuring all sensors in your Meteo-32 measurement project. |
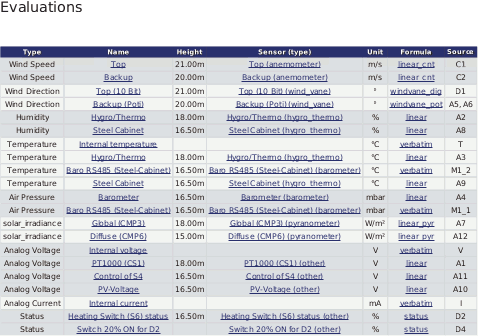
9.2.5. Evaluations
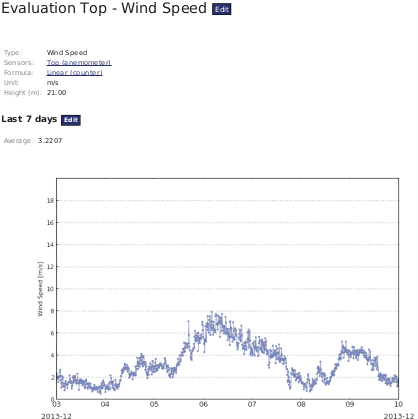
On the data logger details page a table is shown, which lists all sensors and visible evaluations. Click on an evaluation to display type, sensor and formula of the calculation as well as unit of the evaluation. If configured, also the installation height of the sensor is indicated.
If evaluator detail page is opened an XY plot is displayed, which shows the
measurand behaviour of the last 7 days. In order to view another time period, click on
Edit. AmmonitOR also calculates the
Average of the measured values for the selected period.
While being in data logger details page, if List all evaluations is clicked, AmmonitOR displays a table with both visible and hidden (or deactivated) evaluations (see Section 9.2.5.2, “Editing evaluations”). Click on the evaluations to display any details. In order to reactivate a hidden or deactivated evaluation, click on Active checkbox and Save at the bottom of a page.
Figure 9.17. Example: Wind speed evaluation with plot
In the Logger configuration history all configuration changes are listed and the period, for which the configuration has been valid. In order to view the configuration parameters, click on the Configuration ID in the first column. See Section 9.2.5.4, “Modifying the configuration” for modifying the configuration.
9.2.5.1. List of supported evaluations and statistics
| Type as appears in exports | Type as appears in AmmonitOR UI |
|---|---|
| Type in export | Type displayed in AmmonitOR |
| wind_speed | Wind Speed |
| wind_speed_vert | Vertical Wind Speed |
| wind_direction | Wind Direction |
| dir_max_speed | Direction at max. Speed |
| temperature | Temperature |
| temperature_differential | Differential Temperature |
| humidity | Humidity |
| air_pressure | Air Pressure |
| precipitation | Precipitation |
| precipitation_intensity Liquid | Precipitation Intensity Liquid |
| precipitation_intensity Solid | Precipitation Intensity Solid |
| precipitation_intensity Total | Precipitation Intensity Total |
| precipitation_intensity | Precipitation Intensity |
| precipitation_status | Precipitation Status |
| precipitation_sum | Precipitation Sum |
| synop | SYNOP |
| solar_GHI | GHI (global horizontal irradiance) |
| solar_DHI | DHI (diffuse horizontal irradiance) |
| solar_DNI | DNI (direct normal irradiance) |
| # solar_DNI_sw | Calculated DNI (direct normal irradiance) |
| solar_DNIcos_sw | cosine weighted DNI (direct normal irradiance) |
| sun_status | Sun Status |
| sun_status_sw | Calculated Sun Status |
| counter | Counter |
| voltage | Analog Voltage |
| status | Status |
| other | Other Evaluation |
| any | Any Evaluation |
| info | Information |
| voltage u1 | Voltage U1 |
| voltage u2 | Voltage U2 |
| voltage u3 | Voltage U3 |
| current | Analog Current |
| current I1 | Current I1 |
| current I2 | Current I2 |
| current I3 | Current I3 |
| active_power Total | Active Power Total |
| active_power P1 | Active Power P1 |
| active_power P2 | Active Power P2 |
| active_power P3 | Active Power P3 |
| active_power | Active Power |
| power_factor | Power Factor |
| reactive_power Total | Reactive Power Total |
| apparent_power | Apparent Power |
| wind_power_density | Wind Power Density |
| air_density | Air Density |
| turbulence_intensity | Turbulence Intensity |
| device_voltage | Device Voltage |
| device_current | Device Current |
| device_temperature | Device Temperature |
| device_humidity | Device Humidity |
| device_orientation | Device Orientation |
| device_longitude | Device Longitude |
| device_latitude | Device Latitude |
| device_tilt | Device Tilt |
| frequency | Frequency |
| inclination_angle | Angle of Inclination |
| vibration_frequency | Vibration Frequency |
| vibration_amplitude | Vibration Amplitude |
| inflow_angle | Inflow Angle |
| sound_noise_ratio | Sound Noise Ratio |
| obukhov_length | Monin-Obukhov length |
| heat_flux | Heat Flux |
| stability_parameter | z/L |
| altitude | Altitude |
| azimuth | Azimuth |
| duty_cycle | Duty Cycle |
| flash_level | Flash Level |
| bat_passes | Bat Passes |
| bat_pulses | Bat Pulses |
| event_code | Event Code |
| soiling_ratio | Soiling Ratio |
| volumetric_water_content | Volumetric Water Content |
| electrical_conductivity | Electrical Conductivity |
| reference | Reference |
| wind_speed_max | Wind Speed Max |
| variance | Variance (2nd order moment) |
| skewness | Skewness (3rd order moment) |
| kurtosis | Kurtosis (4th order moment) |
| volumetric_flow_rate | Volumetric Flow Rate |
| energy_flow_rate | Energy Flow Rate |
The list of currently supported statistics for evalutaions:
Avg
Min
Max
StdDev
Sum
Count
Val
Value
Median
9.2.5.2. Editing evaluations
If an evaluation is not necessary for any reason, the evaluation can be made invisible by clicking the Active and Save at the bottom of the evaluation list. Hidden or invisible evaluations can be reactivated in the same manner, see Section 9.2.5, “Evaluations”
Evaluations can be edit by clicking on the Edit button displayed in the headline in the evaluation overview page. Label and type of the evaluation can be modified. Here also the evaluation visibility options can be changed.
9.2.5.3. Adding evaluations
In some cases it is required to add further evaluations to a project, e.g., air density. To do so, click on the sensor, which is required to calculate the evaluation.
Click on Add new evaluation to configure the evaluation. The new evaluation will be listed in the evaluation list.
9.2.5.4. Modifying the configuration
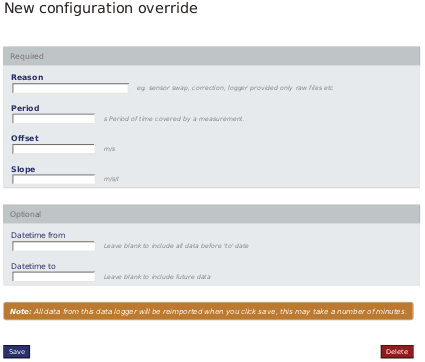
If measurement data has to be recalculated, e.g., due to sensor replacement, slope and offset values can be modified. To do so, select an evaluation and go to AmmonitOR configuration overrides. Click on New configuration override to create a new evaluation.
- Reason
Enter the reason for the configuration override, e.g., replacement of a sensor.
- Period
Only valid for evaluations, whose sensors are connected to counter channels, i.e. wind speed, precipitation. Indicates the period of time covered by the measurement.
For example: Wind speed is calculated by counting the number of cycles (rotations or tics) per second.
1has to be entered in the field Period.- Sensitivity
Only valid for solar irradiation sensors. Enter the sensitivity value given for the new sensor (acc. to calibration protocol).
- Offset
Enter the offset value, given for the new sensor.
- Slope
Enter the slope value of the new sensor
Optionally, you can decide with period should be recalculated. You can choose to recalculate the whole measurement, a defined period, all data before a date or all data after a date.
Figure 9.18. Overriding a sensor configuration (Anemometer)
| Important |
|---|---|
A modified configuration in AmmonitOR does not affect the data logger configuration or the generation of data files. The configuration is only valid for data imported to AmmonitOR. Configurations can be modified multiplied or deleted. In both cases the data is reimported and newly calculated according to the entered period. |
| Important |
|---|---|
Configuration overrides only affect data who is imported to AmmonitOR's database. Imported data is used to display all sorts of plots, reports, analysis calculations and is used for non-original/custom data export formats. Also affected views are matrix view, week's review and measurement data view. |
New AmmonitOR configurations are listed under the Logger configuration history. Configurations can be modified via the Edit button. If further recalculations should be added, click on New configuration override.
The basisc for the configuration override is the electrical channel value. Based on it's value and the formula parameters the new estimated evaluation is calculated. The value can only be approximated, as the source data are not avaliable in AmmonitOR. If the channel value is not present, the hipothetical electrical value is calculated backwards, using the original formula values and then re-calculated with the new inputs. This means that the value is less exact, if the channel values are not present in the system.
Having multiple configuration overrides on one evaluation covering the same time span may result in incorrect values. Always delete the old and invalid configuration override before applying a new one
Applying overrides is a scheduled task that is being queued by the system. It requires some time to be processed. You can monitor it's progress by clicking on thead Details button near the configuration override execution. Always wait for the resolution of the previous override task on a particular evaluation, before adding another one.
9.3. Wind Turbine Information
For different power curve analysis, it can be important to compare your turbine data with other turbines. Use this menu to enter wind turbine data as well as power curve information and power coefficient for comparison reasons. Note that the Rotor diameter is required for power coefficient curve. Once entered wind turbines, can be used by the editing user in different projects. Other users do not have access to the wind turbine.
Go to the → menu to view or edit turbine data. If any data has been entered, AmmonitOR lists the provided turbine information as well as the plot(s) with the turbine power curve.
Figure 9.19. Wind turbine data in toolbox
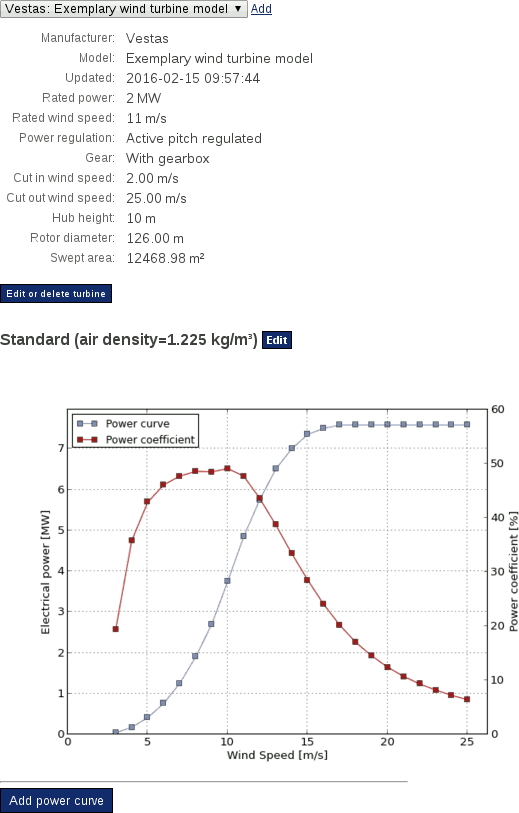
In order to modify turbine data, click on Edit turbine properties; for modifying power curve and power coefficient data, click on Edit next to the air density information. It is possible to enter more than one power curve for a turbine, e.g., if air density varies.
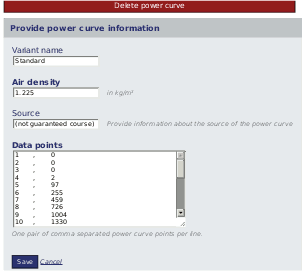
If no turbine data has been provided, click on Add turbine to enter the information. By clicking on Add power curve the characteristical data for the power curve can be entered. For each wind turbine more than one power curve can be provided.
Figure 9.20. Editing a power curve in the toolbox
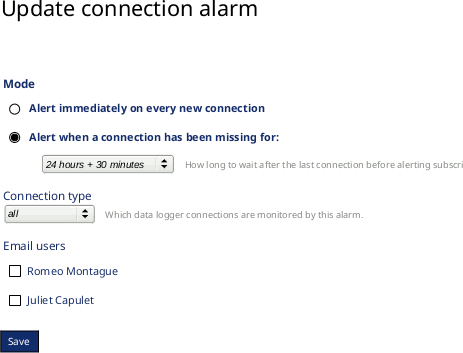
9.4. Connection alarms
AmmonitOR provides an alarm function in case the data logger does not connect for a defined time period or reconnects after a while of no communication.
Click on Add new connection alarm to define a new alarm. Select either Alert immediately on every new connection if you want an email or live data message as soon as the data logger connects to AmmonitOR or Alert when a connection has been missing for... if you want to get an email or live data message as soon as the logger did not send data for a specific time period. Choose type of connection to get alerted if only connection of a specific type dit not occur. Finally select the recipients of the alarm and save.
Figure 9.21. Create a new connection alarm
 |
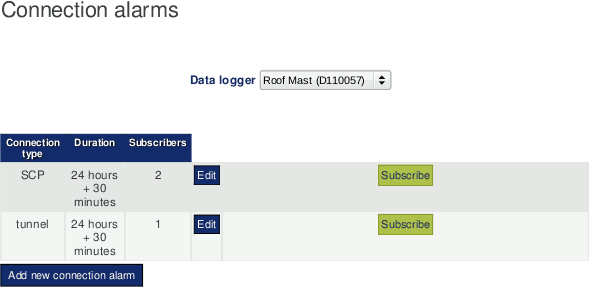
When alarms have been created, it can be seen in the connection alarm overview.
Figure 9.22. Alarm overview
 |
9.5. Filters
In order to check measurement data for plausibility, filters can be implemented. In doing so, AmmonitOR alerts when any filter triggers. Filters can be configured for measurement and system data, e.g. temperature and internal voltage. For example: AmmonitOR can send an alert email or live data message when the voltage of the battery is lower than a defined value. Or measurement data can be highlighted when the temperature is lower than 4 degrees; icing could be a problem.
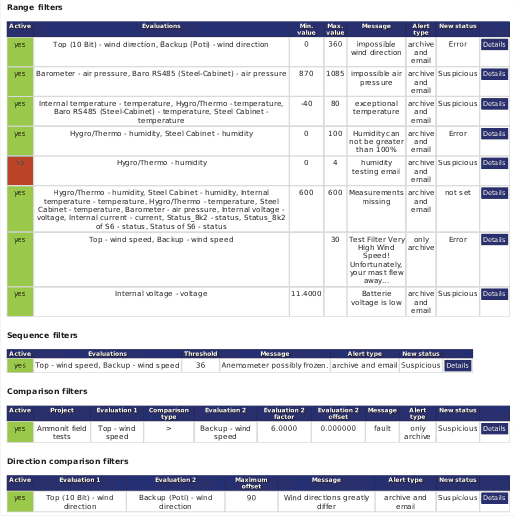
AmmonitOR offers different filters and every type has a special function. Filters can be created and managed in menu → . If filters have been created, AmmonitOR displays the filters in an overview - separated by filter type: Range filters, Empty data filters, Sequence filters, Comparison filters and Direction comparison filters. AmmonitOR lists which filter is active, filter conditions, and what happens when the filter condition applies.
In order to modify, activate or deactivate filters, click on Details. To create new filters for a category, click on Create a new ... filter.
Figure 9.23. Overview filters
| Tip |
|---|---|
AmmonitOR offers a set of default filters for range and sequence filters, which can be uses as examples. Click on Create set of default ... filters to see and edit the filter conditions. |
9.5.1. Range filters
By using the range filters, measurement values, which are out of the normal / expected range, can be detected.
Figure 9.24. Range filter
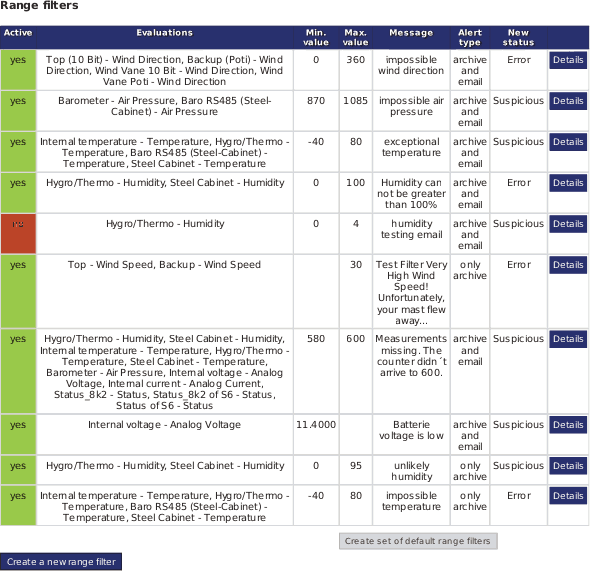
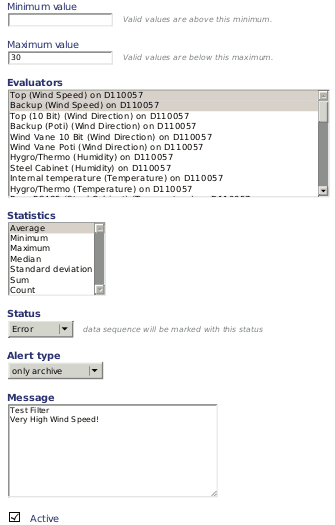
Click on Create a new range filter in menu → . Define the range by entering a Minimum value and a Maximum value. All measurement values fitting into the range are valid. The filter triggers when measurement values are not in the defined range.
After determine the range, at least one sensor has to be selected. AmmonitOR lists
all sensors connected to any of the data loggers related to the project. If more than one
sensor should be selected, hold the
CTRL key and use the left-mouse click to choose the sensors which
should be monitored. In the
Statistics field the statistical value has to be selected, which
should be monitored, e.g., average, minimum or maximum. If more than one statistical
value should be checked, hold the
CTRL key and use the left-mouse click to select further
statistics.
Additionally, it has to be decided, what status the data sequence should obtain, if the defined filter triggers:
- Suspicious
Highlights the affected measurement values in the data overview in yellow colour.
- Error
Highlights the affected measurement values in the data overview in red colour.
Error-marked values are not considered in plots.- No status
Affected data sequence is not highlighted.
| Important |
|---|---|
If the filter status is
|
Finally Alert type and Message have to be determined.
- No alert, only archive
If a filter triggers, AmmonitOR generates a message, which is displayed in the message list of the project.
- Alert via delivery methods and archive
If a filter triggers, AmmonitOR generates a message, which is displayed in the message list of the project and AmmonitOR sends an email or live data message to selected project members.
The text entered in the Message textbox is used for alert and archived message.
Click on Add filter to activate the filter.
Figure 9.25. Example of a range filter for an anemometer
| Tip |
|---|---|
AmmonitOR offers a set of default filters for range filters, which can be uses as examples. Click on Create set of default range filters to see and edit the filter conditions. |
9.5.2. Empty data filters
By using the empty data filters, measurement values, which are missing are found (i.e. None, NULL, N/A, etc.).
Figure 9.26. Range filter
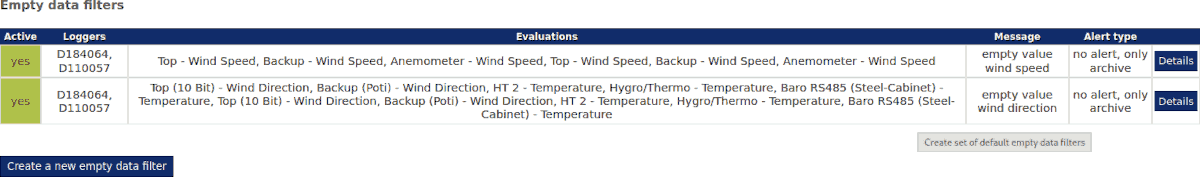
Click on
Create a new empty data filter in menu
→ . Select at least one sensor for which you want to filter emtpy values.
AmmonitOR lists all sensors connected to any of the data loggers related to the project.
If more than one sensor should be selected, hold the
CTRL key and use the left-mouse click to choose the sensors which
should be monitored. In the
Statistics field the statistical value has to be selected, which
should be monitored, e.g., average, minimum or maximum. If more than one statistical
value should be checked, hold the
CTRL key and use the left-mouse click to select further
statistics.
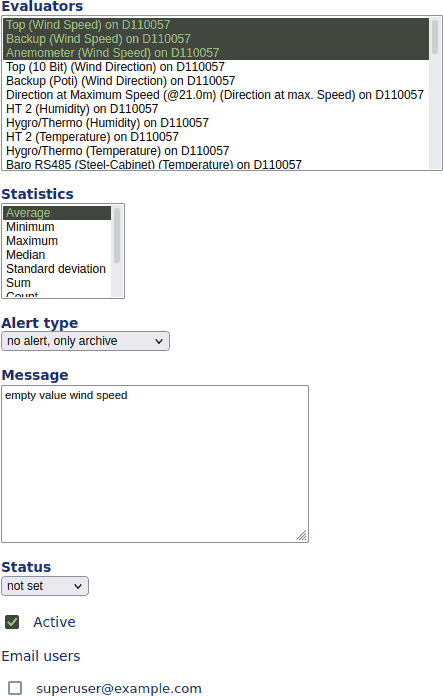
Finally Alert type and Message have to be determined.
- No alert, only archive
If a filter triggers, AmmonitOR generates a message, which is displayed in the message list of the project.
- Alert via delivery methods and archive
If a filter triggers, AmmonitOR generates a message, which is displayed in the message list of the project and AmmonitOR sends an email or live data message to selected project members.
The text entered in the Message textbox is used for alert and archived message.
Click on Add filter to activate the filter.
Figure 9.27. Example of an empty data filter for an anemometer
 |
| Tip |
|---|---|
AmmonitOR offers a set of default filters for empty data filters, which can be uses as examples. Click on Create set of default range filters to see and edit the filter conditions. |
9.5.3. Sequence filters
In order to detect measurement values that do not change over a certain period of time, such as frozen anemometers in icing situations, Sequence Filters can be configured. Use these filters to recognize problems with the sensor or missing measurement values.
Figure 9.28. Sequence filter
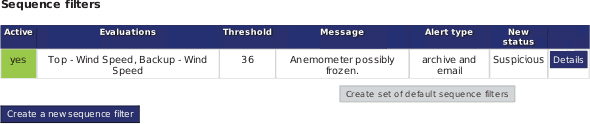
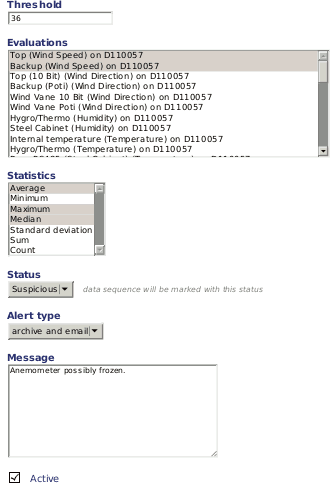
Click on Create a new sequence filter in the → menu to configure a new filter.
- Threshold
Indicates the minimal number of subsequent identical values, which should be considered suspicious.
- Evaluations
Select the evaluation, which should be monitored. AmmonitOR displays all evaluations with the serial number of the data logger, to which the evaluation pertains.
If more than one evaluation should be monitored, hold the
CTRLkey and use the left-mouse click to highlight the evaluations.- Statistics
Choose from a list the statistic which should be considered for the filter.
If more than one statistical value should be checked, hold the
CTRLkey and use the left-mouse click to select the statistics.- Status
Suspicious: Data sequence is marked in yellow colour in the data overview.
Error: Data sequence is marked in red colour in the data overview. Errors are considered as measurement errors and are not displayed in plots.
- Alert type
only archive: AmmonitOR lists date and number of matched entries when the filter applied.archive and email: As above. Additionally, AmmonitOR send an email to the project members to inform about the filter.- Message
Enter a message which is displayed in the filter overview and in the email text, if the alert type is
archive and email.
Figure 9.29. Example of a sequence filter
| Tip |
|---|---|
AmmonitOR offers a set of default filters for sequence filters, which can be uses as examples. Click on Create set of default sequence filters to see and edit the filter conditions. |
9.5.4. Comparison filters
These filters compare data of two different sensors at the same time.
Figure 9.30. Comparison filter
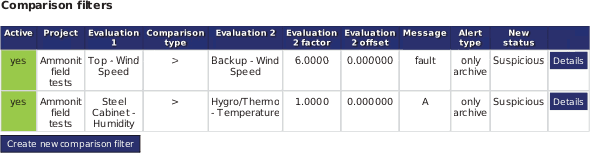
Parameters for Comparison Filters
- Active
defines if the filter is active. only active filters will be used to check anything.
- Message
a text which will be used if the filter triggers and generates a message.
- Alert type
Possible values are
no alertandemail.no alertmeans, that the generated message will be archived, but there won't be send an email or sms.emailmeans, that the generated message will be archived and an email will be send.- Sensor 1
Sensor 1 for the comparison
- Comparison type
The type how to compare Sensor 1 with Sensor 2
- Sensor 2
Sensor 2 for the comparison
- Sensor 2 factor
A factor for the value of sensor 2
- Measurand status
Measurand statusdefines the status of the measurands from both sensors after the measurands trigger the filter.
Example 9.1. Simple filter to check difference between two temperatures
The following filter should generate a message and set the measurands status to
suspicious if the value of Temperature 1
t1 is greater than 105% of the value of temperature 2
t2. The equation for this filter is:
Equation 9.1. Linear Equation
- Active
True- Message
Value of temperature 1 >> value of temperature 2- Sensor 1
t1- Comparison Type
>- Sensor 2
t2- Sensor 2 Factor
1.05- Measurand Status
Suspiciou
Example 9.2. Anemometer 1 Windspeed must be lower than Anemometer 2 Windspeed
The following filter should generate a Message and set the measurands status to Suspicious if the value of Anemometer1 (Height: 10 m) is greater than the value of Anemometer 2 (Height: 80 m). The equation for this filter is:
Equation 9.2. Linear Equation
- Active
True- Message
Value of Anemometer 1 >> value of Anemometer 2- Sensor 1
s1- Comparison Type
>- Sensor 2
s2- Sensor 2 Factor
1.0- Measurand Status
Suspicious
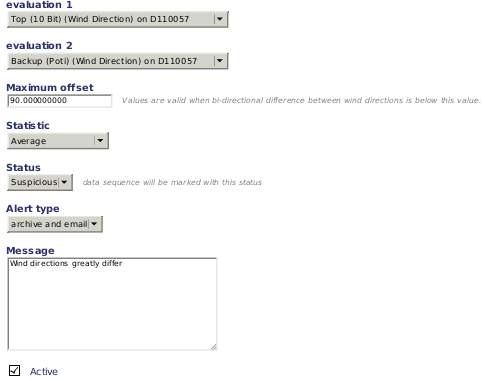
9.5.5. Direction comparison filter
The Direction Comparison Filter correlates wind direction data of two wind vanes. Click on Create new direction comparison filter in the → menu to add a new filter.
Figure 9.31. Direction comparison filter
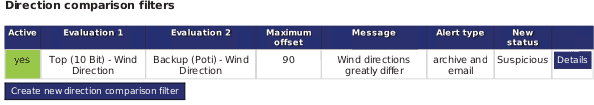
- Evaluation 1 / Evaluation 2
Select the wind vanes which should be compared.
- Maximum offset
The entered value indicates the maximum deviation between both evaluations. If the difference between both evaluations is greater than the
Maximum offsetthe filter triggers.Example: If you entered 50 for the offset value and the difference between evaluation 1 and evaluation 2 is 60, the filter triggers. If the difference is 50, the filter does not trigger.
- Statistic
Select a statistic, which should be monitored.
- Status
According to the selected status, the data sequence will be marked in the data overview.
Suspicious: The data sequence is marked yellow in the data overview.
Error: The data sequence is marked red in the data overview and is not considered in plots.
- Alert type
only archive: AmmonitOR lists date and number of matched entries when the filter applied.archive and email: As above. Additionally, AmmonitOR send an email to the project members to inform about the filter.- Message
Enter a comment, which will be displayed in the filter overview and in the email sent, if alert type is
archive and email.
Figure 9.32. Example of a direction comparison filter
9.5.6. Editing filter details
| Important |
|---|---|
Only users with
|
Filter conditions can be edited in the → menu by clicking on Details of a listed filter. Click on Edit on the filter details page to modify filter conditions.
If a filter should be deactivated or deleted, click on the Details button of the selected filter in the overview. In the options section you can Deactivate or Delete this particular filter.
AmmonitOR lists all matched entries data logger by data logger on the filter details page. It is shown on which day the filter condition triggered and how many entries are affected. By clicking on an entry the measurement data for this day is displayed. Suspicious data is marked yellow; errors are marked red (according to the entered filter condition).
9.5.7. Copy filter settings
| Important |
|---|---|
Only users with
|
Already created Filters can be copied to another project, where the user has write access. → menu by clicking on Copy of a listed filter.
It is possible to copy single filter schemes or the whole section of an specific
filter type e.g. Range Filters. It is also possible to copy a filter schema to multiple
target projects, who can be SHIFT selected.
If a specific filter is copied the parameters, statistics and alert type will be transmitted to the target project. If the evaluation selection of the origin filter has certain evaluation types included, the evaluation type selection will also be applied in the new project.
In case of an Range Filter the parameters like Min and Max values as well as the statistics will be copied to the target project. If in this example only Wind Speed evaluations were selected, the newly created filter in the target project will also contain only Wind Speed evaluations.
| Important |
|---|---|
Be aware of adjusting subscribers, cause the subscriber list can't be copied. Check also the evaluations automatically selected by the copy-process, if they are the ones you want this filter to be applied. |