Chapter 5. Monitoring
Table of Contents
The Monitoring section provides the control about current status of your projects and data loggers. AmmonitOR shows an overview about your project related devices, measurement data for the last seven days, a completness overview and a connection overview.
5.1. Devices
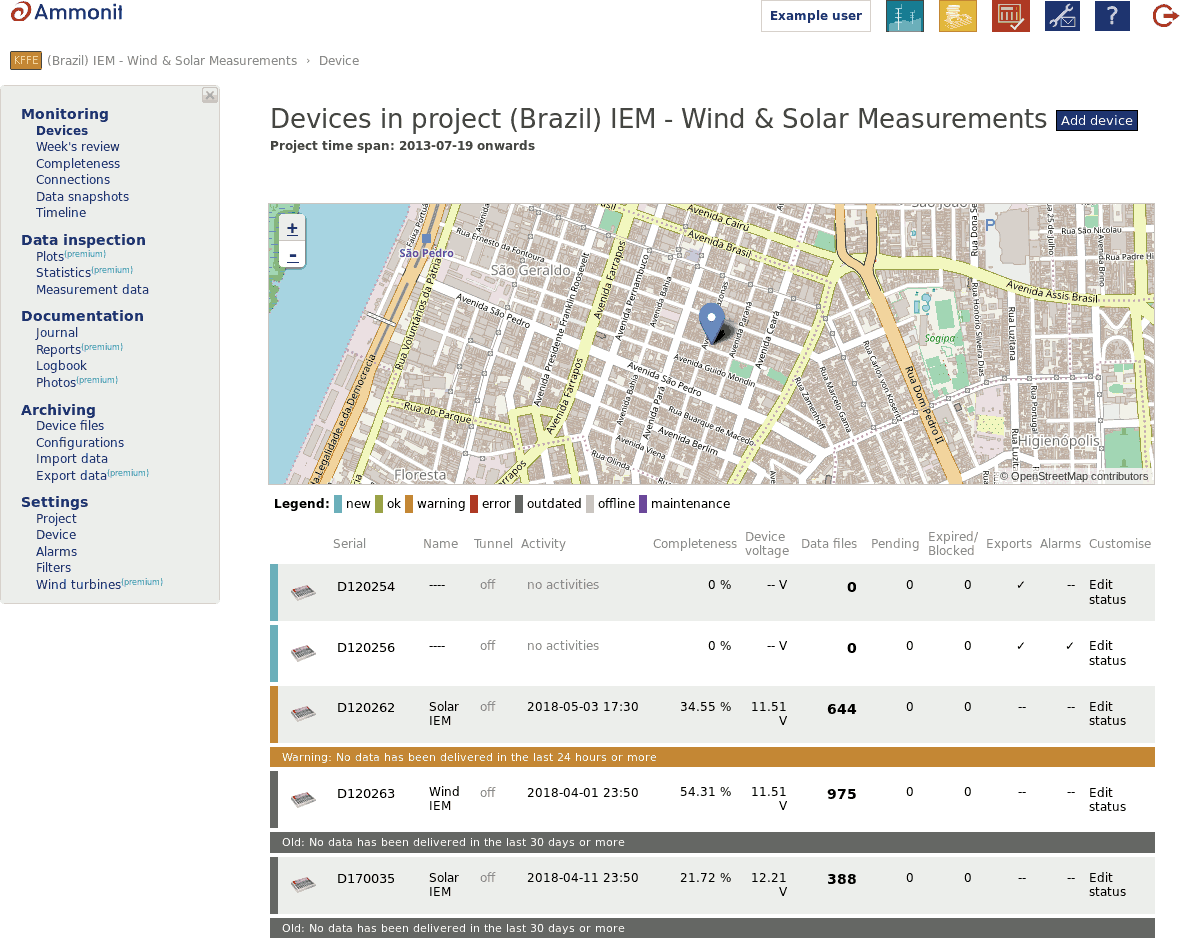
A list of all data loggers in your project can be found by clicking on Devices in the side menu. AmmonitOR displays logger location map together with a sortable table of all devices in a project, consisting of the most important information regarding a device. The Latest activity is shown, which influences the project colour. Each colour is explained in a legend above the table (i.e. green - ok, data arrived on time). If data are late, the comment appears on the bottom of a list element, explaining the encountered issue. Among the displayed data the most recent Device voltage value is displayed, Total number of data files and more. The device status can be manually overwritten by clicking the button.
Click on the data logger, to view details of the data logger, e.g., related project and active sensors. For further details see Section 9.2, “Data Logger Information”.
Figure 5.1. List of project related data loggers
 |
The data loggers are sorted by serial number in ascending order.
See also Section 9.2, “Data Logger Information”.
5.2. Matrix
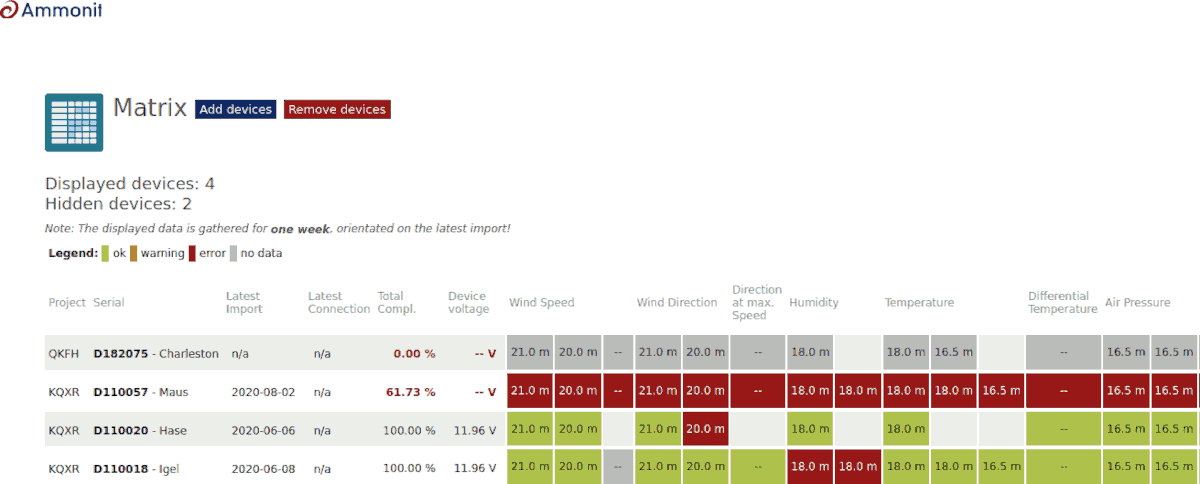
The Matrix is a table, which displays active devices the user has read access to. The Matrix is found either in Project under → or on the → .
Every device is displayed with many attributes and values, which are important for monitoring and daily updates on your system. For every displayed device are columns with all evaluations color coded to quickly get an idea what is going on. The color is influenced either by data completeness or filter matches. Setup customised Filters in the settings Section 9.5, “Filters”. Clicking on tiles opens a popup, which shows exactly what filters matched and what status is connected with a filter match. For example if you configured a sequence filter (see Section 9.5.3, “Sequence filters”) for an anemometer to detect frozen bearings and set the filter status to Suspicious, the tile is colored orange if a match occurs.
The displayed evaluations are also listed in the related project (see Section 9.2.5, “Evaluations” or click on List all evaluations on the device overview page).
![[Important]](admon/important.png) | Important |
|---|---|
AmmonitOR's Matrix displays the values for the last 7 days. Beginning with the date of the last import! |
To customise AmmonitOR's Matrix add or remove devices with the buttons placed next to the caption of the side (see Figure 5.2, “List of devices in AmmonitOR's Matrix view”). Devices have to be activly added to the Matrix.
Figure 5.2. List of devices in AmmonitOR's Matrix view
 |
| Important |
|---|---|
AmmonitOR Matrix is only updated by data import. Click on the evaluation's tiles to see on the bottom of popup the datetime of the last refresh. |
| Important |
|---|---|
For LiDAR devices the overall completeness shows just if data is complete. It does not show the quality of data. For the wind speed and wind direction evaluation are the availability shown, what shows if data is complete and the quality and validity of data. Data is invalid if data availability is less than 80%. |
5.3. Week's Review
For a quick system check, AmmonitOR provides an overview about all evaluations and system parameters over the last 7 days. To check the system performance, go to the → menu and select a data logger.
AmmonitOR displays all evaluations, which are listed in the evaluation list (see Section 9.2.5, “Evaluations” or click on List all evaluations on the data logger overview page).
| Important |
|---|---|
AmmonitOR displays the values for the last 7 days. Beginning with the current date - not the date of the last import! |
Click on Details to see the xy plot and make further adjustments. See also Section 6.1.2.6, “XY plot”.
5.4. Completeness Calendar
AmmonitOR displays for each data logger a Calendar, which can be accessed via the → menu. The Calendar displays the data completeness for each day, taking into account the number of measurement periods in a day. This means that the completeness will be shown as 100% also if the data will be filled with None / Null values. The completeness data is also shown only for the imported data.
The Calendar is structured in months and days; one row per month.
Figure 5.3. Data calendar
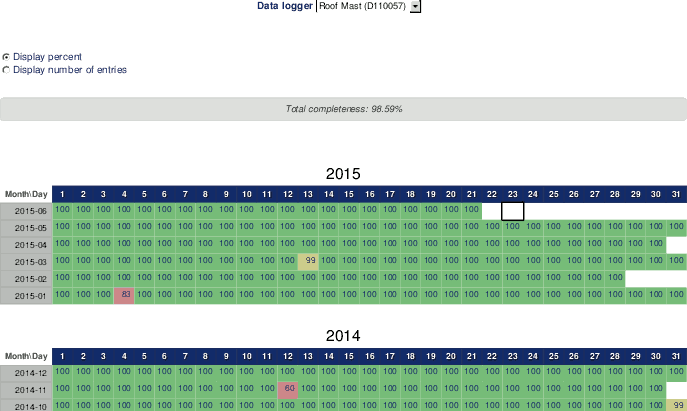 |
Depending on the number of entries for a day, AmmonitOR colours the cell background (see Table 5.1, “Data Calendar Colours”).
Data completeness for the data logger is shown below the Calendar. The completeness value refers to the whole period covered by the calendar.
If more than one data logger has been assigned to the project, you can switch between the calendars of the data loggers using the dropdown list above the calendar. There are two table view options: percent or number of entries.
- Display percent
This table view shows all entries as percentage value from the expected number of entries, e.g., 50 if 72 entries of expected 144 are counted.
- Display number of entries
This table views displays the exact number of entries for each day.
Table 5.1. Data Calendar Colours
| Colour | Percentage | Number of Entries | Comment |
|---|---|---|---|
| Green | 100% | 144 | Total data completeness for the day. |
| Yellow | 99.9 ... 95% | 136 ... 143 | A few entries are missing or faulty. |
| Orange | 90 ... 94.9% | 129 ... 135 | Critical number of entries. |
| Red | 0 ... 89.9% | 0 ... 128 | Not enough entries for a relevant measurement according to MEASNET. |
| Violet | >100% | >144 | If data has been uploaded twice caused by an error, AmmonitOR has more data available than expected for the day. An alert message is displayed on AmmonitOR. The issue can be solved by archiving data files. To do so, click on the link in the alert message and deactivate the file(s) in the → menu. The selected data file is archived - not deleted! If necessary, the data file can be reimported. For further details see Section 8.1, “Data Logger Files”. |
| Important |
|---|---|
AmmonitOR's Completeness Calendar shows not the validity of quality of the data, but the entry completeness, whether all data arrived like expected. |
Click on a day to review the daily measurements. AmmonitOR shows a data table with all data for the selected day. To customize the data table see Section 6.3, “All measurement data”.
5.5. Connections
On this page the connections of all Meteo type devices can be monitored. AmmonitOR displays the connections for the last 30 days. Users can easily see when the connection started and how long the data logger was online. Place the mouse pointer in the graphic to see further details of the connection or use "View text" to see a tabular representation.
The connections should correspond to the periods and actions configured in the schedule in the Meteo-40, Meteo-40 Plus and Meteo-42 web interface.
The AmmonitConnect online periods are shown in blue, primary statistics file uploads in orange and full config files in teal.
In order to view connections older than 30 days, click on earlier connections. AmmonitOR moves 30 days back and displays this period. Via later connections you can move to later periods. If there is no current connection, you can show the latest connection by clicking on go to latest connection.
Figure 5.4. Connection overview
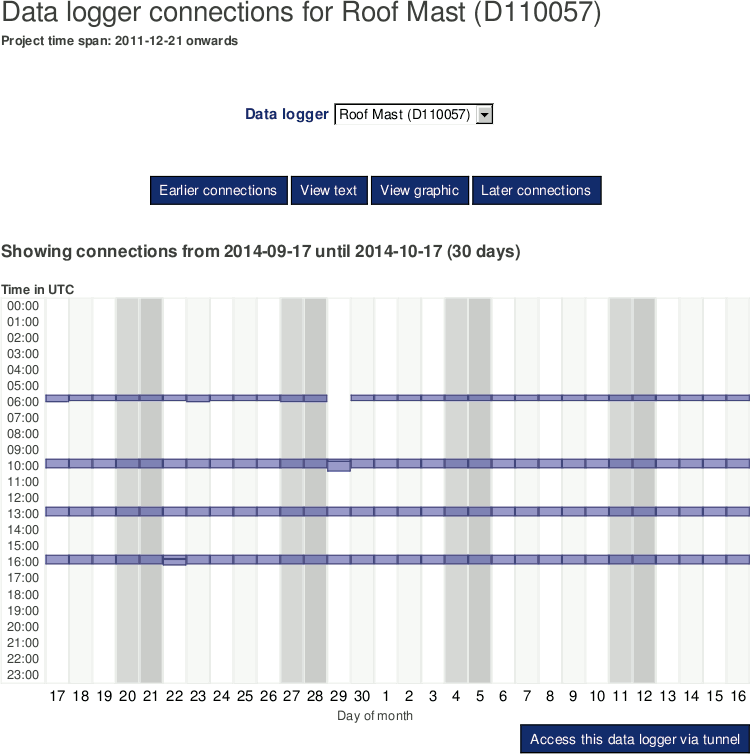 |
If the displayed data logger is scheduled to be online, you can access the data logger via tunnel by clicking on Access this data data logger via tunnel.
Holding the mouse pointer on the button, the URL of the data logger is displayed.
![[Note]](admon/note.png) | Note |
|---|---|
Tunnel connections of Meteo type devices can be monitored without uploading measurement data to AmmonitOR. To do so, the connection between device` and AmmonitOR has to be configured in the Meteo-40, Meteo-40 Plus and Meteo-42 web interface in the → menu. Select the AmmonitOR server and enter your Project key in the relevant fields. Deselect the checkbox Send CSV files (active by default). The checkbox Send Logbook data (active by default) has to be selected to provide tunnel information to AmmonitOR. Save the configuration. Thus no measurement data is sent to AmmonitOR - only communication information. |
5.6. Data snapshots
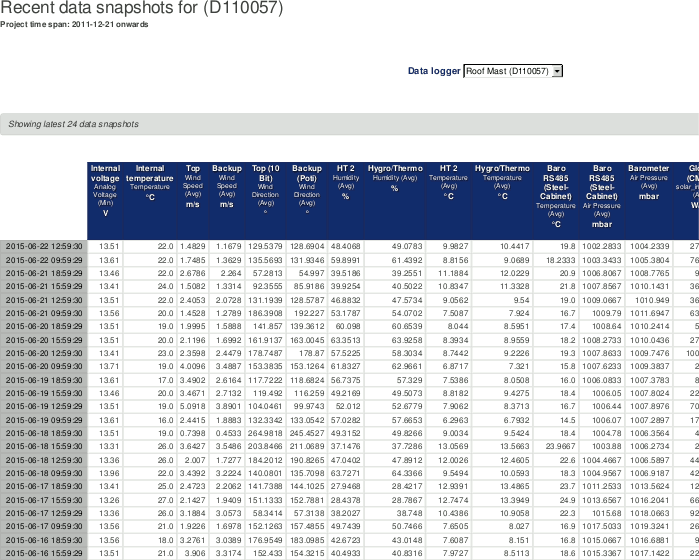
The data snapshot page shows the last 24 data snapshots, who are sent by Meteo-40, Meteo-40 Plus and Meteo-42 data logger. Therefore the Meteo-40, Meteo-40 Plus and Meteo-42 data logger has to be configured to send the snapshots to AmmonitOR. A data snapshot is a data set e.g. of 10 minute average values of each channel. The difference to normal data transmission is, that data snapshot is always sent when the data logger connects to the internet. Keep that in mind when you configure the Meteo-40, Meteo-40 Plus and Meteo-42 schedule. It is helpfull to know the actual condition of the measurement system in addition to the normal daily data transmission.
For configuring a Meteo-40 data logger, the checkbox Send data scnapshot has to be selected in the → menu of the Meteo-40 web interface. The checkbox is disabled by default.
Figure 5.5. Data snapshots in AmmonitOR
 |
5.7. Timeline
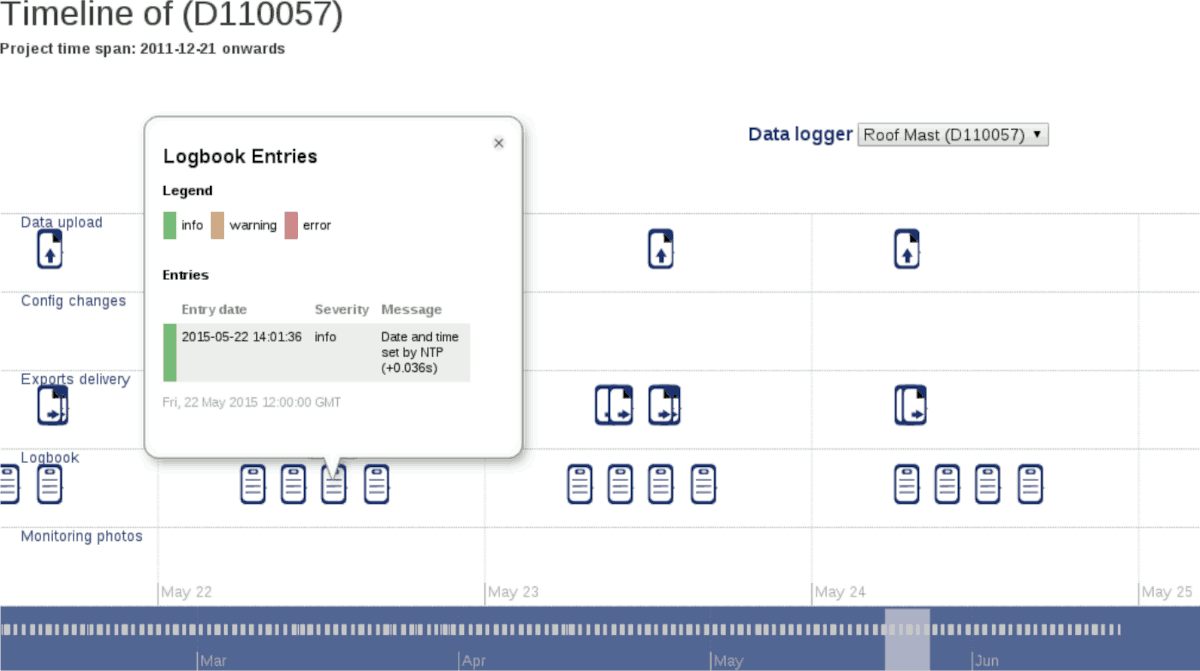
The timeline is a monitoring tool, where all important events are listed in an interactive time frame. You can scroll monthwise and daywise. If events are triggered in measurement system they will be displayed. Click the event icon and detail information of will occur.
Figure 5.6. Timeline in AmmonitOR
 |
5.8. Live Data Aggregator
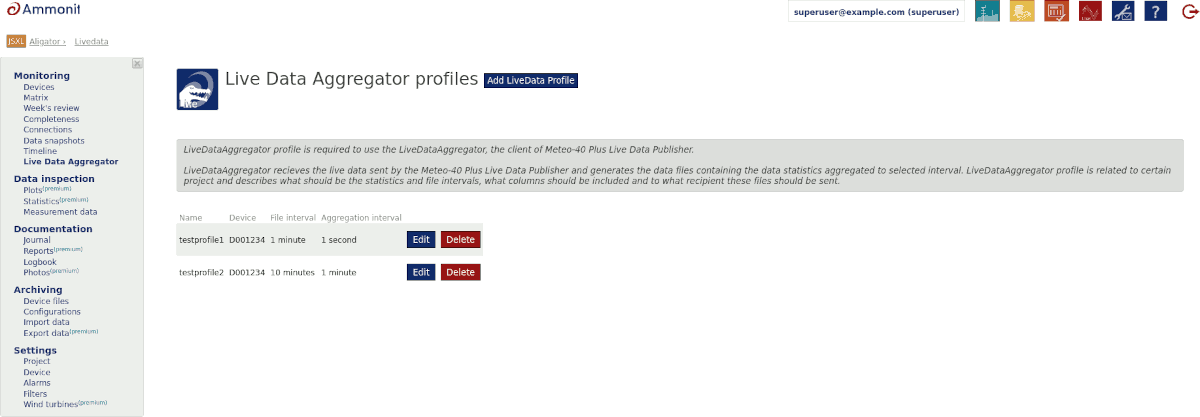
The Live Data Aggregator profile is required to use the Live Data Aggregator, the client of Meteo-40 Plus and Meteo-42 Live Data Publisher. It generates the data files on the server from the incoming livedata and requires configuring profiles for each Meteo-40 Plus and Meteo-42 device for which the files should be generated.
LiveDataAggregator receives the live data sent by the Meteo-40 Plus and Meteo-42 Live Data Publisher and generates the data files containing the data statistics aggregated to selected interval. LiveDataAggregator profile is related to certain project and describes what should be the statistics and file intervals, what columns should be included and to what recipient these files should be sent.
To configure a new LiveDataAggregator profile a Add LiveData Profile button must be pressed. If you wish to edit the pre existing profiles or delete them, click on Edit or Delete respectively. On the detele, a new page will be opened, where the deletion of the profile must be confirmed.
Figure 5.7. LiveDataAggregator profile list
 |
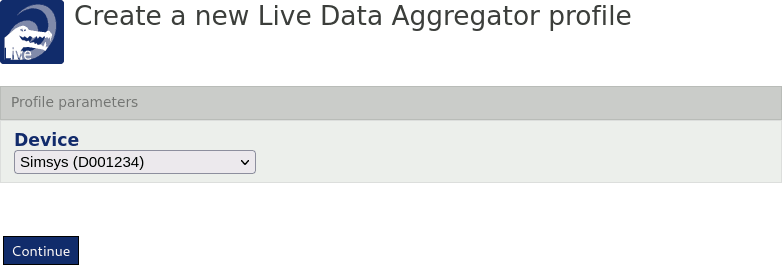
When configuring a new LiveDataAggregator profile, a device for which a profile is going to be created must be specified
Figure 5.8. LiveDataAggregator logger selection
 |
After that, certain settings must be inputted:
- Profile name
Name to distinguish between your profiles. Allows inputting only alphanumerical characters are allowed, without the whitespaces.
- Data file interval
Interval of the output files from LiveDataAggregator.
- Data aggregation interval
Interval of the output aggregated measurements inside of the file from LiveDataAggregator. Select 1 second to receive the source data.
- Included columns
Select which columns should be included in the file from LiveDataAggregator If you pick Custom... a detailed table of every possible column will be shown.
- Hostname
For now we support only FTP method of delivering the files from LiveDataAggregator. Please put your FTP server hostname or IP address here.
- Username
FTP server username used for logging in.
- Password
FTP server password used for logging in.
- Directory
Optional directory field for path where your files should be stored on your FTP server.
- Port
FTP server port used for communication.
Figure 5.9. LiveDataAggregator profile
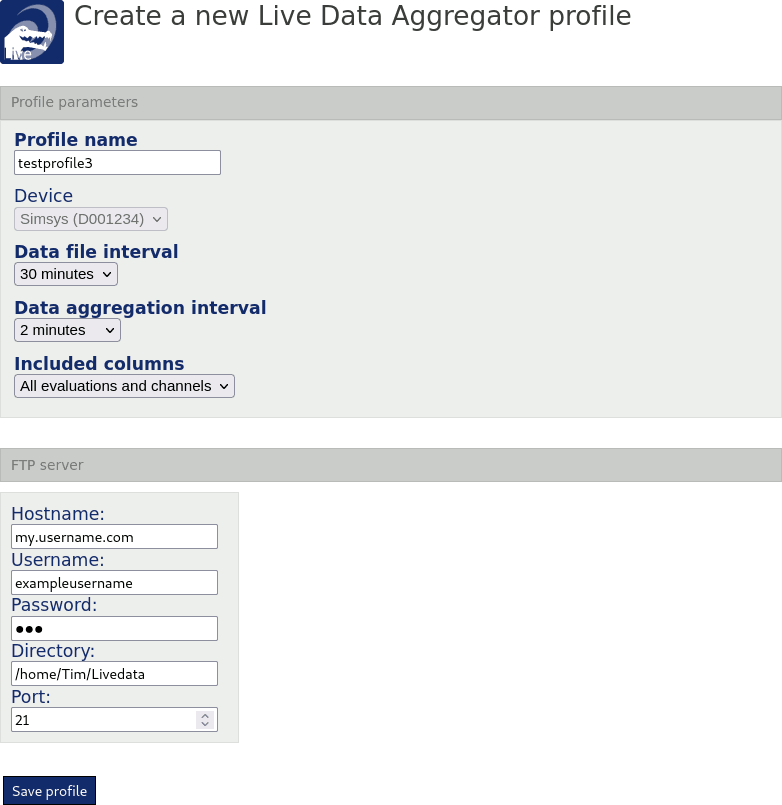 |
After you are ready press Save profile and you will be re-directed to the profile list. The same procedure applies to editing the pre-exissting profile.