Table of Contents
As soon as Recording in the status box (see Section 3.2, “Global Control Elements”) is switched on, Meteo-40 records and stores measurement data. In order to check current data, the web interface offers the possibility to have a closed look at live data (see Section 6.2, “Live Data Page”). In the menu, measurement data can be downloaded (see Section 6.7, “Access to Source Data” and Section 4.2, “System Administration”) and statistics can be configured, which will be saved as CSV file.
This page displays the currently measured data. The data is presented in a table and in a line chart.
Click on Start to display currently measured values. Stop ends displaying data. The table shows the total amount of available data. In comparison, the line chart can be customized by choosing sensors and connected channels.
![[Note]](admon/note.png) | Note |
|---|---|
Enable JavaScript in your web browser to display live data in a chart. |
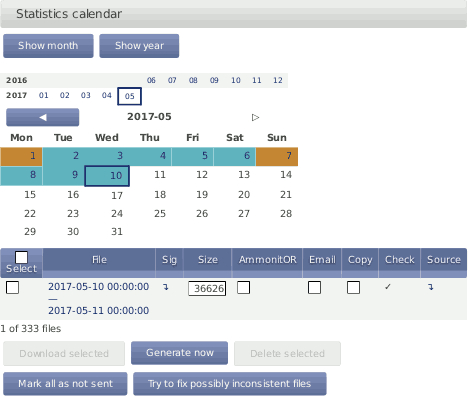
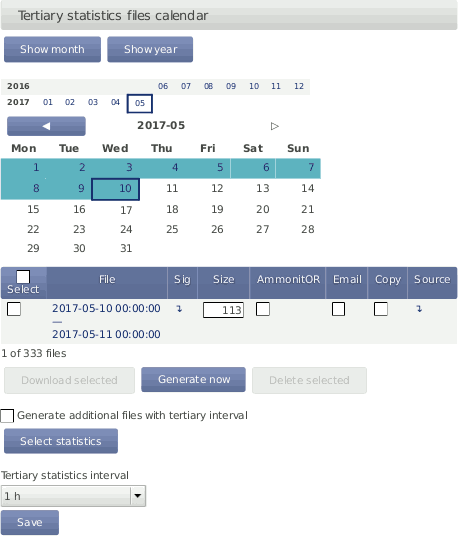
In the → menu CSV files with statistics are listed and can be downloaded. Meteo-40 shows a calendar with available statistics. Click on a month to highlight days with available CSV files. To navigate through the calendar, click on a month or use the arrows to move one month ahead or back. Click on a highlighted day to list all CSV files, which have been generated for this day.
To view the available CSV files for a whole month, click on Show month; for a complete year, click on Show year. You can jump between the years and months by clicking on a month resp. year in the calendar.
All CSV files for the selected period are listed in a table, the file name refers to the time interval covered. For each file, a link to download the corresponding signature, its size in bytes, the methods through which the file has been shared and a link to visualize the matching source data are available. To display the source data corresponding to a file, click on the arrow in the Source column.
Below the list of CSV files it is indicated how many statistics CSV files are currently visible, from the available files in the data logger, e.g., 1 of 53 files.
If CSV files have been uploaded to an AmmonitOR project, sent per Email or copied to a configured SCP/FTP server, it will be tagged by a checkmark in the corresponding box.
To manually download or delete one or more files, select them and Click Download selected or Delete selected respectively. For the download, the CSV files will be compressed in one ZIP file. If you want a certain file to be sent or copied again, you can also mark the selected files as not sent with the option Mark as not sent
![[Important]](admon/important.png) | Important |
|---|---|
Deleting CSV statistic files does not delete the corresponding source data, statistic files can be generated again as long as the matching source data are still in the Source data storage. |
To immediately generate statistic files form the available source data, click on Generate now. Meteo-40 will generate new files for the configured file interval, containing a line with the calculated statistics for each statistics interval. For the standard configuration of daily file interval and ten minutes statistics interval, there will be 144 lines.
If Generate partial files is selected, not only the files for a complete file interval will be generated but also a file with the residuary data until the moment of the generation. This setting is only recommended for testing porpouses.
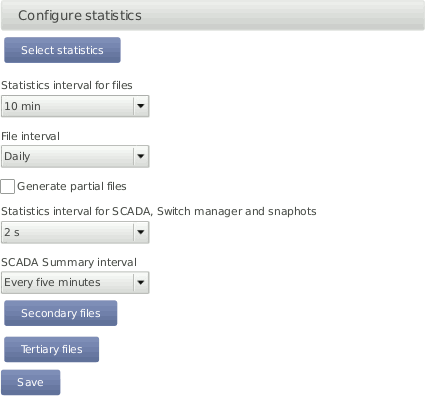
In order to configure statistics and CSV files, go to the → menu. You can define content and interval of the statistics.
Meteo-40 automatically suggests the standard statistics for each evaluation and channel. Additional statistics can be selected manually.
Click on Select statistics in the Configure statistics section to create the statistics, e.g., average, maximum, minimum, standard deviation, count, sum and median. Tick checkboxes to include evaluators / channels in the statistics. Remove checkboxes to exclude evaluators / channels. Additionally, Meteo-40 displays internal current and internal voltage in the CSV files.
The options are:
- Select statistics
Select individual statistics for every evaluator and channel. See Figure 6.4, “Statistics Configuration Page”.
- Statistics interval for files
Defines over which time interval statistics are calculated, generating a new line in the CSV file. All current data that has been collected since the last generated file is considered to generate new aggregate data. Several intervals are available from 1/4 s to 1 h.
- File interval
Determines, how often a new aggregate data file in CSV format has to be created. Selecting Hourly, produces one file per hour that includes data from the last hour. Daily generates only one file per day, etc. Several intervals are available from every 5 minutes to weekly. The file interval is also applied to Gust data files.
- Generate partial files
Generate CSV files up to the current moment, even if the file interval has not yet finished.
- Statistics interval for SCADA, Switch manager and snapshots
Defines over which time interval statistics are calculated. The calculation occurs at the end of the interval and the data are available over SCADA, applied to Switch manager or sent/copied as a snapshot. All current data from that period is considered to generate new aggregate data. Several intervals are available from 1/4 s to 1 h.
- SCADA Summary interval
Applied only to the Summary statistic of the SCADA Modbus server. Typically used to obtain a daily summary of sun status or precipitation measurements.
- Secondary Files
Suplementary statistics files can be generated with a different interval for the statistics calculation. Secondary statistics can be configured here. See Section 6.4, “Secondary and Tertiary Statistics Files”.
- Tertiary Files
A further suplementary statistics interval can be configured here. See Section 6.4, “Secondary and Tertiary Statistics Files”.
![[Warning]](admon/warning.png) | Warning |
|---|---|
Be careful with setting the statistics interval and the file interval! Low values for the statistics interval lead to huge statistics files, which you might need to remove manually once in a while. Low values for the file interval lead to many small CSV files, which might be hard to handle. |
For solar-related evaluations Meteo-40 estimates certain values in addition to the measured values, i.e., estimated sun status, estimated direct normal irradiation. In order to create the estimated values, the GPS location of the measurement station has to be entered in the → menu. By default the estimated values are not included in the CSV file. If required, select the values for the statistics.
Meteo-40 uses vectorial calculations for wind direction, i.e., vectorial average, direction maximum, direction minimum, and vectorial standard deviation (Yamartino method). Hence, the calculated minimum value for the wind direction can be higher than the maximum in case of wind from northern directions.
The equation for the average wind direction d is given by Equation 6.1, “Calculation of wind direction average”. If d is less than zero, 2π is added.
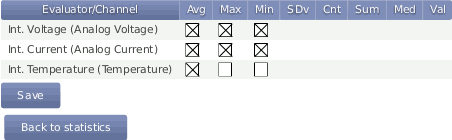
Press Save to finish the configuration of statistical values.
Under Maintenace we provide some options for trouble-shooting in case of CSV files generation problems.
Automatic system storage clean-up tasks are performed on CECS start in order to preserve the correct operation of the system. If more than 20000 CSV files are present on startup, all CSV files which can be identified as shared (via AmmonitOR, Email, SCP/FTP or USB flash-drive copy) are automatically deleted. You can also force the deletion of all already shared files by pressing the Delete sent statistics button.
Previous to generating a new CSV file the state of the storage is checked as well. If the available storage was insufficient or the number of CSV files was greater than 20000, the oldest CSV files which have already been shared are deleted.
| Important |
|---|---|
If none of the listed sharing options is used (AmmonitOR, Email, SCP/FTP or USB flash-drive copy), the data logger will not remove any existing files. This can lead to not generating any new files in case of memory shortage or even to a system malfunction in case of very large amount of files (over 40000). For this use case, you can choose to allow the deletion of the oldest files in order to free space by activating the option Automatically delete oldest files if needed. |
The Fix checked files button will inspect all existing files, search for known incidences and regenerate the files if needed. This option is only available if the data logger detects any suspicious files. CSV fiiles which have been replaced with an empty file as described in Delete sent statistics will be marked as suspicious.
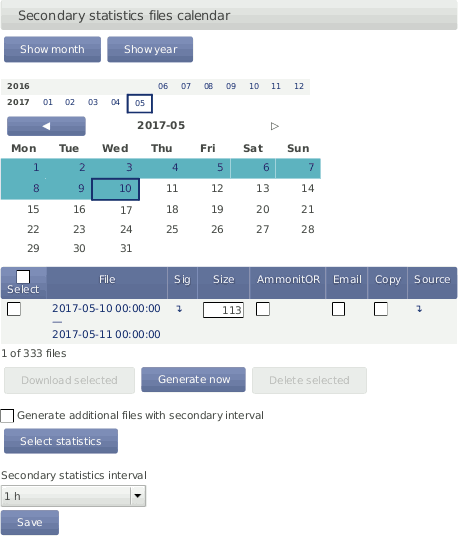
Sometimes it is necessary, to have additional statistics on top of the standard. E.g. with a different statistics interval or a different selection of values. You can activate the supplementary generation of statistics files with two different configurations. The files will be listed in a similar table as the main statistic files (see Figure 6.5, “Secondary Statistics Page” and Figure 6.6, “Tertiary Statistics Page”). If the files are generated, they will be automatically sent per Email or AmmonitOR additionally to the main statistic files.
| Warning |
|---|---|
Beware, that having more CSV files
|
Select Generate additional files with secondary interval to activate the generation of the secondary files. You can configure a statistics interval different from the main statistics interval. To select the statistics which will be calculated and included in the secondary files, clik on Select statistics.
Select Generate additional files with tertiary interval to activate the generation of the tertiary files. You can configure an statistics interval different from the main and the secondary statistics interval. To select the statistics which will be calculated and included in the secondary files, clik on Select statistics.
Detecting extreme wind events or gusts can be interesting to compare different geographical terrains or to estimate wind turbines load. Meteo-40 offers the possiblity to genere extra CSV files including the sensible measurement values with the highest available measurement rate. To generate gusts data files you must activate this option in menu → .
One gusts CSV file will be generated per day (or the configured file interval in → menu) including all wind gusts of that period. If no gust was registered during the period, an empty file is generated. Empty files will not be visible in the Gust data files calendar but will be listed beneath.
To be considered a gust, the selected trigger evaluation must exceed the configured threshold value a minimum number of consecutive repetitons ( minimum repetitions parameter) and not more than the selected maximum repetitions. The gust as well as the previous and posterior number of seconds specified by time overhang parameter are included in the gusts CSV file (see .
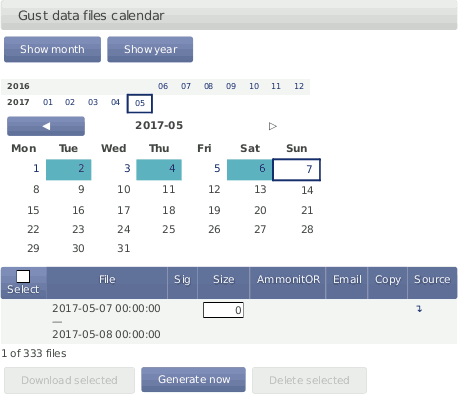
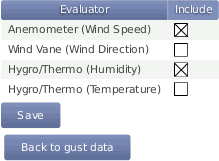
Not every existing measurement is related to gusts analysis. The relevant evaluations must be selected. Press the Select evaluations button to access the evaluations selection site and select which evaluations must be included in gusts CSV files.
| Important |
|---|---|
If the gusts data generation is activated in a running project, all existing source data will be analyzed and gusts CSV files will be generated. This process could take several hours. |
Meteo-40 stores measurement data in standard Comma-Separated Value (CSV) format with appended information in ini file format. The CSV file is documented in RFC 4180 and well explained, e.g., in Wikipedia. Ini files are described, e.g., in Wikipedia as well. CSV files can easily be read by many programs and software tools, as is the ini file format.
| Note |
|---|---|
In almost all cases, the CSV files created by Meteo-40 are compressed using
GNU gzip with the typical file extension
|
The measurement data files of the Meteo-40 use the
,(comma) as field separator,
"(double quote) for embedding commas in textual strings and UTF-8 as
character set.
The statistics files generated by Meteo-40 data loggers are structured in two parts, the data in standard CSV format and additional information in so-called ini file format. Both parts are separated by one empty line.
The CSV part starts with a header line. This line is a comma-separated list of the statistics for each active channel and evaluator. The first item of the list is the date/time entry.
The date and time value shows the start time of the statistics interval. Date and
time format are similar to ISO-8601, e.g.,
2014-07-17 15:50:00. The date and time values are always the local
time of the data logger. The timezone is stated in the second part of the file.
The evaluator statistics have the form
Sensor;Evaluation;Statistic(e.g.,
Anemometer;wind_speed;Avg or
WindVane10bit;wind_direction;Count). Thereafter, the channel
statistics are displayed in the form
Channel;Statistic(e.g., A2;Avg or C1;StdDev).
The statistics can individually be selected per sensor in the → menu (see Figure 6.4, “Statistics Configuration Page”).
According to the configured statistics interval, Meteo-40 calculates the
statistics. Each time period is represented in a line of the CSV file. The values are
generally decimal numbers, using a point (
.) as decimal mark.
Language settings of the data logger do not have an influence on the CSV file.
The following evaluation types are available:
wind_speed: Wind Speed, |
wind_direction: Wind Direction, |
humidity: Humidity, |
temperature: Temperature, |
temperature_differential: Differential Temperature, |
air_pressure: Air Pressure, |
air_density: Air Density, |
solar_irradiance: Global Horizontal Irradiance, |
solar_irradiance_diffuse: Diffuse Horizontal Irradiance, |
solar_irradiance_direct: DNI·cosθ, |
solar_DNI: Direct Normal Irradiance (DNI), |
solar_irradiance_direct_sw: Estimated DNI, |
solar_DNIcos_sw: Estimated DNI·cosθ, |
sun_status: Sun Status, |
sun_status_sw: Estimated Sun Status, |
precipitation: Precipitation, |
precipitation_intensity: Precipitation Intensity, |
precipitation_status: Precipitation Status, |
precipitation_sum: Precipitation Sum, |
wind_speed_vert: Vertical Wind Speed, |
counter: Counter, |
voltage: Analog Voltage, |
current: Analog Current, |
status: Status, |
active_power: Active Power, |
power_factor: Power Factor, |
reactive_power: Reactive Power, |
apparent_power: Apparent Power, |
obukhov_length: Obukhov Length, |
dir_max_speed: Direction at max. Speed, |
brightness_max: Brightness max. Value, |
brightness_direction: Direction of Brightness, |
frequency: Frequency, |
inclination_angle: Angle of Inclination, |
vibration_frequency: Vibration Frequency, |
vibration_amplitude: Vibration Amplitude, |
other: Other Evaluation, |
any: Any Evaluation |
The following statistics are available:
Avg: Average, |
Max: Maximum, |
Min: Minimum, |
StdDev: Standard deviation, |
Count: Count of valid values, |
Sum: Summary, |
Med: Median, |
Val: First valid value |
The information part contains data logger information as well as sensor details like installation height, slope and offset values, as well as unit and sensor name.
The information part is included in every file. It can be found below the statistical data. The overall format of the configuration is the following:
[Section 1]
key1=value
key2=value
[Section 2]
key1=value
All section names, keys and values are case-sensitive and may contain unicode characters in UTF-8 encoding. While sections and values may contain spaces; keys will not. Each section is unique; each key is unique within its section. Neither the order of sections nor the order of entries within the sections are significant or guaranteed.
[System]: Serial number in the formatserial=D123456and type of the data logger in the formattype=Meteo-40Lthe assigned name; timezone in the formattimezone=UTC+01:00(the offset can be positive or negative or be missing, which indicates UTC); the location in decimal degrees and altitude in meters:latitude=0.0 longitude=0.0 altitude=0.0as well as the software version and important system settings, e.g.,cecs_power_permanent=true.[Summary]comprises the date and time when the CSV file has been created, the used source data storage and the summary over the file time interval for configured precipitation, precipitation intensity, status and sun status evaluations.[Evaluation]indicatesfile_intervalandstat_interval(see also Section 6.3, “Statistic Data Files”).The
file_interval, usuallydaily, can have the following values:fiveminutestenminutesfifteenminutestwentyminutesthirtyminuteshourlytwohoursthreehoursfourhourssixhourstwelvehoursdailyweeklyThe
stat_interval, usually10 min, can have the following values:1 s2 s3 s5 s10 s20 s30 s1 min2 min5 min10 min15 min20 min30 min1 h[Adjustment]:CS1andCS2are the calibration values for the current source of Meteo-40. The values are for informational purpose only.[Master]: Therateof RS485 is given in s, min or h;serial_settingfor RS485 includes speed without unit, as well as data format in conventional notation (e.g., 9600 8N1).[Sensor;Evaluator]statistic: List of statistics, which are calculated for the sensor, e.g., average, min, max.unit: Unit for the data, e.g.,m/s.sensor_label: Name, which has been entered by the user in the sensor configuration.sensor_height: Installation height in meters, which has been entered by the user in the sensor configuration.sensor_type: Indicates the type of the sensor, e.g.,anemometer. The following values are possible:anemometer: Anemometer,wind_vane: Wind Vane,hygro_thermo: Humidity / Temperature Sensor,barometer: Barometric Pressure Sensor,precipitation: Precipitation Sensor,pyranometer: Solar Sensor,ultrasonic: Ultrasonic Anemometer,power_meter: Power Meter,other: Other Sensorsensor_model: The model of the sensor, e.g., Thies First Class Advanced.formula: The type of formula used to convert the electrical values, e.g., linear.formula_params: Parameters, which are referenced to in the formula, including related channels and evaluator parameters, e.g.,A5 A6 var_offset var_slope. Values of the parameters are displayed in the lines below the formula parameters, e.g.,var_offset,var_slope,var_period,var_sensitivity.
[Channel]statistic: List of statistics, which are calculated for the channel/sensor. For each statistic a column is displayed in the upper part of the CSV file.unit: Unit of the calculated data. This is the SI unit for the type of quantity, however the unit for barometric pressure might be eitherhPaormbar, and the temperature unit is°CorKfor differential temperature.rate: Configured rate for the channel with unit (not applicable for Master channels).range: Configured range for analog voltage channels (Ax) with unit.protocol: Protocol, which is used for digital channels (Dx).
![[Tip]](admon/tip.png) | Tip |
|---|---|
Use LibreOffice Calc or OpenOffice.org Calc. These are free, professional spreadsheet programs to process your CSV files. |
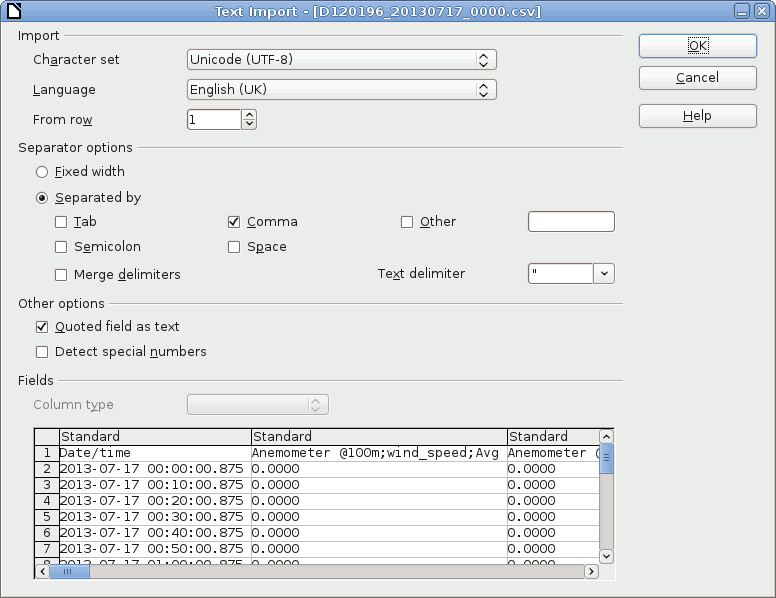
The recommended settings to import the CSV file are shown in Figure 6.9, “LibreOffice CSV-file import settings”.
Depending on the version of Microsoft Excel™ the procedure can be slightly different. In general, we recommend using the import assistant of Microsoft Excel™.
| Note |
|---|---|
Save CSV files always in a directory. The described process in Microsoft Excel™ does not work, when files are opened via your email program. |
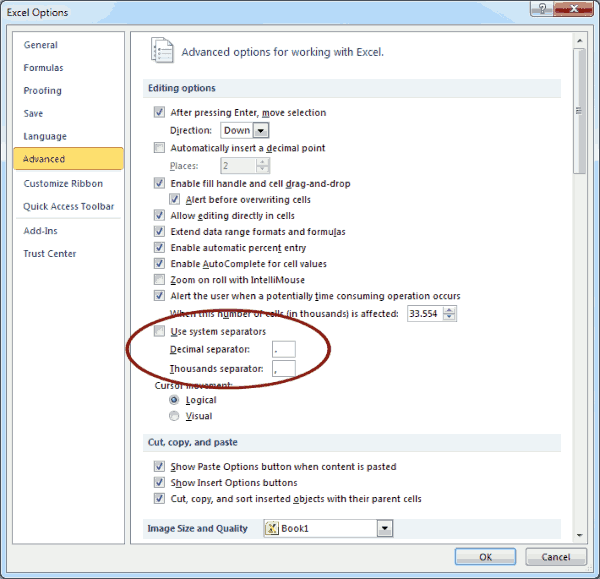
Launch Microsoft Excel™ and open the Options window, which can be found in the File menu. Open the Advanced menu. In the Editing options section deselect Use system separators and use
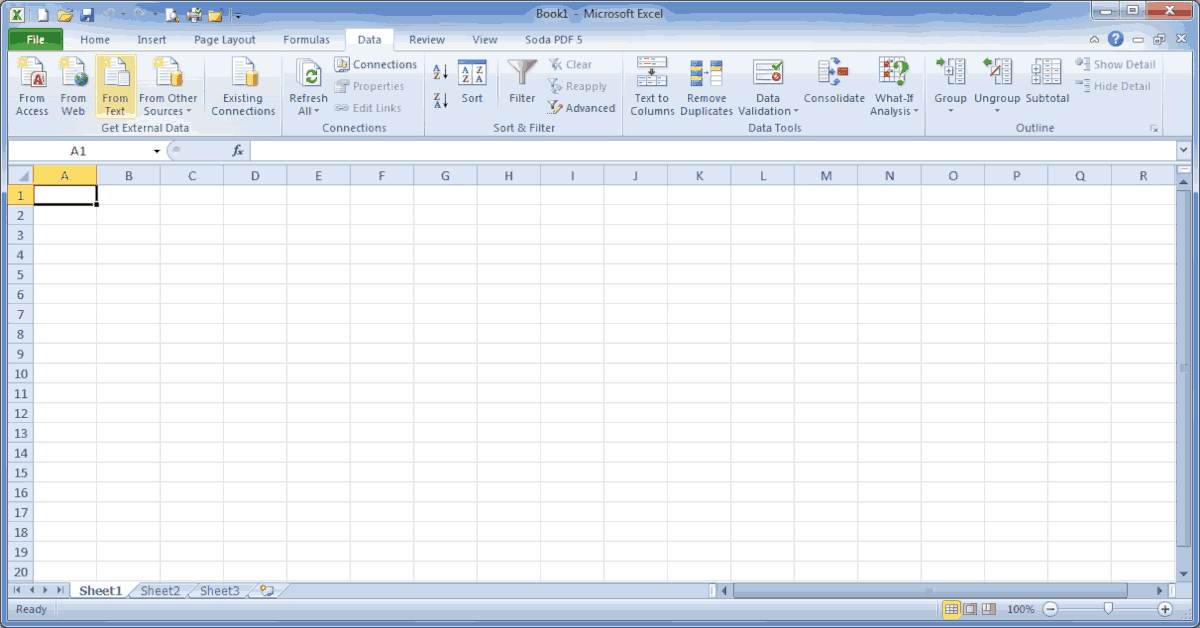
.(dot) as decimal separator and,(comma) as Thousands separator. See figure Figure 6.10, “ Microsoft Excel 2010™ CSV Import (1)”.After setting the options, click on the Data tab as shown in Figure 6.11, “ Microsoft Excel 2010™ CSV Import (2)”. In order to import the CSV file, click on From Text in the group Get External Data, locate and double-click the file you want to import. Follow the instructions in the Text Import Wizard.
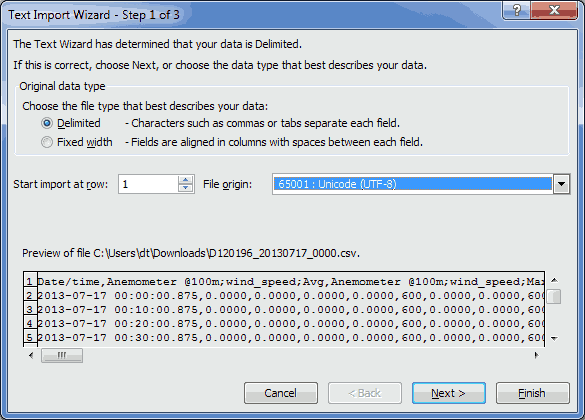
In the first step of the wizard choose Delimited as Original data type and select Unicode (UTF-8) for the file origin. See Figure 6.12, “ Microsoft Excel 2010™ CSV Import (3)”.
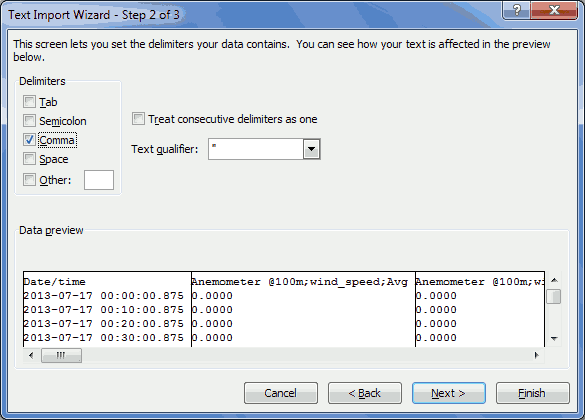
In next step define Comma as delimiter and " as text qualifier as shown in Figure 6.13, “ Microsoft Excel 2010™ CSV Import (4)”.
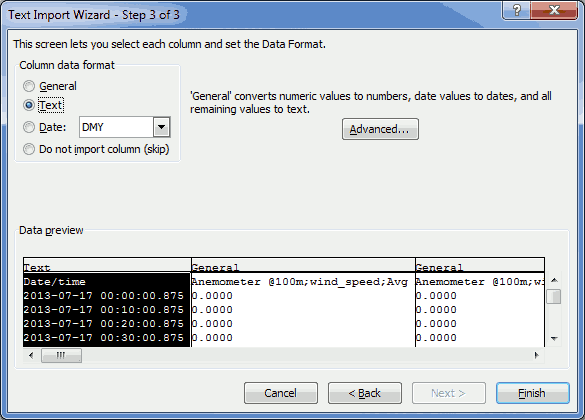
In the last step of the wizard, select Text for the data format columns. See Figure 6.14, “ Microsoft Excel 2010™ CSV Import (5)”.
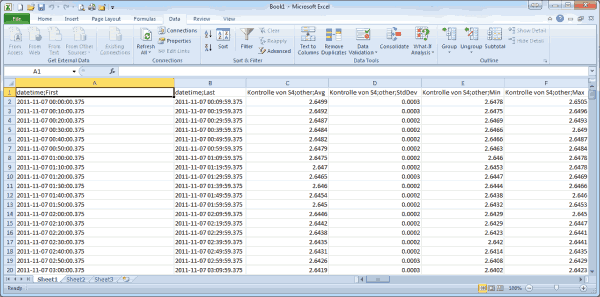
By clicking on Finish the file opens in your selected sheet. See Figure 6.15, “ Microsoft Excel 2010™ CSV Import (6)”.
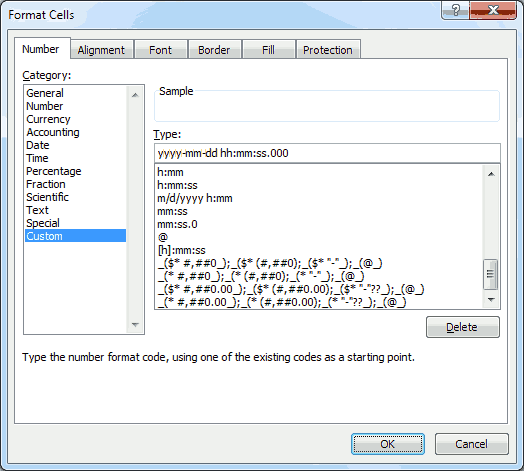
In order to change the cell format of the date and time columns from text to date time format, highlight the column(s) and open Format Cells in the Numbers group on the Home tab. Select Custom and enter YYYY-MM-DD hh:mm:ss.000 as shown in Figure 6.16, “ Microsoft Excel 2010™ Format Cells”.
Source data contains all electrically measured values neither interpreted nor with any statistical evaluation applied. If source data is available and the used sensors are known, it is possible to re-evaluate a complete measurement campaign.
| Important |
|---|---|
Source data is only recorded, when recording is switched on! |
The source data storage is organized as a ring buffer, which means that the oldest data will be overwritten, when the storage is filled entirely. For compactness reasons data is saved in a binary format and cannot be read directly. However, you can view or download data.
To view or download source data, go to the → menu. Meteo-40 displays all months and related days, on which source data is available. As shown in Figure 6.17, “Screenshot of the Source Data Page”, select month, day and time period to display related source data in the table below.
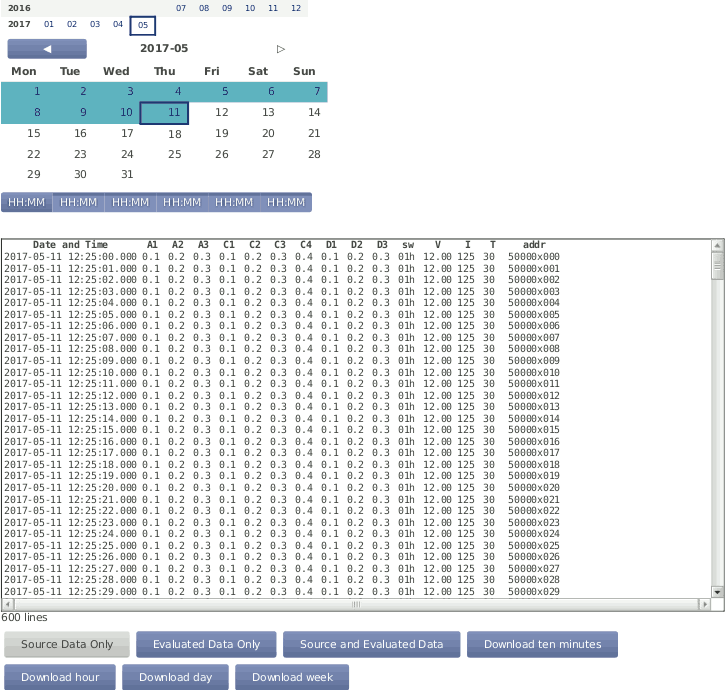
The displayed source data can be downloaded as CSV file by clicking on the buttons below the table.
- Download ten minutes
Click to download a CSV file with source data of the selected 10min-period.
- Download hour
Click to download source data of the selected hour, i.e., source data of one table row. The source data in the downloaded CSV file starts with 00:00 min and ends with 59:59 min.
- Download day
Click to download source data of the selected day, i.e., the source data of the whole day from 00:00:00 to 23:59:59. If source data of the current day should be downloaded, the CSV file includes all data up to the download moment.
| Warning |
|---|---|
The volume of downloaded source data can be huge, e.g., a filled 2 GB memory can lead to a 10 GB CSV file. |