Table of Contents
Meteo-40 SCADA Server can be used to monitor performance and production of wind farms
by providing reliable meteorological data. Meteo-40 data loggers support the standard
protocols
Modbus TCP/IP over Ethernet as well as
Modbus RTU over RS485 (Slave).
SCADA parameters can be configured in the → menu. In order to activate SCADA for Meteo-40, select the checkbox Activate SCADA server.
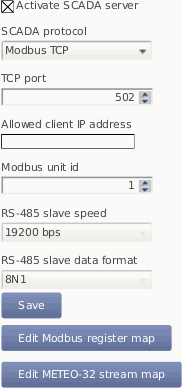
Depending on the SCADA system in which Meteo-40 is integrated, a protocol for data retrieval has to be chosen:
- Modbus TCP over Ethernet
If you use Modbus TCP, a TCP port has to be entered. The default value is 502. If Allow global access is selected, the scada server will be accessible over every available TCP connection (e.g. Ethernet, Modem, USB-B), otherwise it will only be available over the Ethernet connection. By entering an IP address in field Allowed client IP address, the access to the data can be restricted to a single IP. Only the client with the specified IP address can request data from Meteo-40. If the field is left empty or filled with value 0.0.0.0, any client is allowed to access the data. You can also introduce a list of IP addresses separated by a semicolon (;), e.g., 192.168.13.5;192.168.14.6.
![[Note]](admon/note.png)
Note In most SCADA systems, the Ethernet interface should be configured properly with a static IP address. Refer to Section 7.7, “Configuring LAN Parameters” for further details.
![[Important]](admon/important.png)
Important If a USB modem is connected to Meteo-40 and Ethernet is used for SCADA, it is necessary to select
Connect to Internet via USB modem onlyin the → menu.In order to connect Meteo-40 to a fiber optic, an industrial media converter 10/100BaseT to 100BaseFX (-40–75 °C) can be used.
Make sure that your Modbus TCP client is addressing the Meteo-40 SCADA server with the proper Modbus unit ID configured here. The default value is 1.
Modbus TCP uses the unit identificator for routing purposes in case of addressing a device on a MODBUS or MODBUS+ serial line subnetwork. The Modbus TCP server is still sensitive for this parameter. For further details see MODBUS Messaging on TCP/IP Implementation Guide V1.0b recommendations at The Modbus Organization.
- Modbus RTU over RS485 S (slave)
If you are using the Modbus RTU protocol, Modbus Unit ID and RS485 serial settings (speed and data format) have to be selected.
Note Some SCADA clients require a half-duplex (2-wire) RS485 interface. In order to convert the 4-wire RS485 signal delivered by Meteo-40 Revision C data loggers into a 2-wire (half duplex) signal, an accessory module has to be implemented. Refer to the separate data sheet provided by Ammonit. For further details contact Ammonit.
The production of Meteo-40 Revision C stopped in October 2012.
The accessory module is not necessary for Meteo-40 Revision D data loggers (with Ethernet port).
If you are using more than one Meteo-40 data logger in your SCADA system, each data logger requires a unique Modbus Unit ID and all data loggers have to use the same RS485 serial settings (speed and data format).
- Meteo-32 Stream
Used for streaming Meteo-32 data. A Meteo-32 stream map has to be configured. Refer to Section 8.4, “Replacing Meteo-32 Data Loggers used for SCADA” for further details.
Save your settings. Otherwise, the configuration is reset to the previous values after moving to another page.
| Important |
|---|---|
To use Meteo-40 SCADA server, the CECS must remain permanently on ( CECS always active mode) Figure 8.2, “Configuring CECS always active mode for SCADA”( → . This mode is automatically set when the SCADA server is activated in the → . You can only switch it off again after deactivating the SCADA server. |
The CECS always active mode can be configured manually via the web interface (see Section 4.2, “System Administration”) or over the display ( → , see Section 9.5, “Menu: Status”) of the data logger.
If
CECS always active mode is selected, it will be displayed in the
status box of the web interface with the
infinity symbol (∞) as well as on the Meteo-40
display with the word
Always.

If power supply is disconnected and the data logger shuts down while CECS was running in the CECS always active mode, it will restart automatically as soon as power is available again.
| Note |
|---|---|
When CECS is configured to be permanently active, you cannot manually shut down the system by pressing the middle button on the data logger. |
| Important |
|---|---|
CECS is a fully embedded Linux™ computer (see also Section 1.4, “The Two Systems of Meteo-40”). Be aware that the power consumption of Meteo-40 is higher, when CECS is switched on. |
It is possible to request both live data and statistics over SCADA (see available statistics). The time interval over which the SCADA statistics will be calcuated can be modified in menu → menu (see also Section 6.3.1, “Configuring Statistics and CSV files”).
| Important |
|---|---|
The same statistics interval is used for SCADA, the Switch manager and the data snapshots. |
Summary statistic is normally used to calculate the summary over a complete day. It is available for precipitation, precipitation intensity, status and sun status evaluations. The SCADA summary interval defaults to daily and can be changed in → menu.
The Modbus register map in the Meteo-40 web interface only shows the selected statistics from the → menu. Go to the → menu and select the required data. See also Section 6.3.1, “Configuring Statistics and CSV files”.
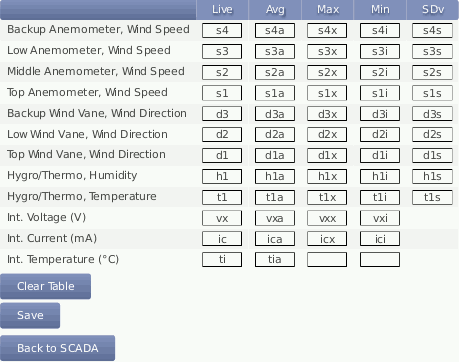
The configurable Modbus Register Map allows Meteo-40 to operate in most existing SCADA systems. The user must determine which measurement values should be available for the SCADA Master and configure a unique register number for each measurement (PDU addressing, first reference is 0). Two separate data bocks are available for input and holding registers. For more information about the supported function codes see the public function code definition from the Modbus application protocol specification The Modbus Organization.
All registers in range 0 to 65535 not selected to hold a measurement will contain the hexadecimal value FFFFh. If the register is selected but no valid measurement is present, the invalid value corresponding to the configured data type is written (see Table 8.1, “Modbus Invalid values”).
Table 8.1. Modbus Invalid values
| Data Type | Invalid Value |
|---|---|
| short (16-bit integer) | 7FFFh |
| ushort (16-bit unsigned integer) | FFFFh |
| long (32-bit integer) | 7FFFFFFFh |
| ulong (32-bit unsigned integer) | FFFFFFFFh |
| IEEE 754 (32-bit single precision binary floating point) | 7FC00000h |
| Unix Time | 00000000h |

- Column
Measurements Name of the evaluation, channel, or measurand. For every measurand either two or four registers are used, depending on the data type selected (see Table 8.2, “Optional Available Information and configuration”).
Name of date, time, and switches fields. Every single value needs one register, with the exception of the UNIX time (seconds since
1970-01-01 00:00:00 GMT), which needs two registers.- Columns statistics (
Live,Avg, ...Med) In these fields, the modbus register number where each measurement value will be contained must be introduced.
- Type
For each evaluation or channel, a data type can be selected, e.g.,
float, (see Table 8.2, “Optional Available Information and configuration”).- Factor
For each evaluation or channel, a scale factor can be selected, e.g.,
float, (see Table 8.2, “Optional Available Information and configuration”).
- Live data
Describes instantly measured data of the active channels (
An,ACn,Cn,Dn,Mn,Pn) and switches (Sn) as well as instantly evaluated data (Top Anemometer Wind Speed (m/s), Precipitation (mm), etc.). All live data values, including Live Date/Time and Live Unix Time, are written in the Modbus store with an atomic operation. This guarantees that the time-stamps, in case configured, match the measurement values.- Aggregated / statistical data
Statistics can be applied to channels and to evaluated data. All statistics data values, including Statistics Date/Time and Start-End Unix Time, are written in the Modbus store with an atomic operation. This guarantees that the time-stamps, in case configured, match the measurement values
The SCADA interval for statistics calculation ('Statistics interval for SCADA, Switch manager and snapshots') defaults to 10 minutes and can be configured in the → menu. This interval is applied for standard statistics: average (Avg), maximum (Max), minimum (Min), standard deviation (SDv), sum (Sum, only for status signals), median (Med) and value (Val). For the Summary statistic, 'SCADA summary interval' is applied, which defaults to daily. The summary statistic is calculated as a simple moving statistic at the end of every SCADA interval for statistics calculation (i.e. 10 minutes with the default configuration).
Important Only measurements selected in menu → (see Figure 6.4, “Statistics Configuration Page”) are available here for retrieval.
In order to configure the Modbus slave address of the data logger for serial subnetworks, go to the → menu. For further details about Modbus see: www.modbus.org.
Table 8.2. Optional Available Information and configuration
| Option | Description |
|---|---|
|
Measurements Data Type and Scale Factor |
Date/time values, i.e., year, month, day, hour, minute, and second, as well as state of the switches are represented as unsigned short values, stored in one 16-bit Modbus register each. Data type and scale factor do not apply to these values. For the measurement value representation, data type and scale factor have to be selected. Data types short, ushort, long and ulong represent a measurement value as an integer and store it in one or respectively two subsequent 16-bit registers. To achieve higher resolution on the representation or a wider range of values represented with a lower resolution, the original measured value can be divided by a scale factor before storing it into the registers as an integer. The default data type is IEEE 754 standard in binary32 format (32-bit single precision binary floating point), being values stored in two subsequent 16-bit Modbus registers. In this last case, scale factor 1 is recommended. See also Equation 8.1, “Scale Factor”. |
|
Modbus Endianness for SCADA Server |
According to the Modbus Application Protocol Specification V1.1.b, Modbus is a 'big-Endian' protocol: "Modbus uses a 'big-Endian' representation for addresses and data items. If a numerical quantity larger than a single byte is transmitted, the most significant byte will be sent first." Meteo-40 endianness can be configured by the user via web interface and is set by default to 'big-endian' byte order and 'big-endian' registers order representation (high byte first, high word first). For example for value -4.395978e-11, the representation would be: Table 8.3, “Modbus Endianness for SCADA Server” |
|
Modbus register address interpretation |
For historical reasons, some devices use a starting offset to refer to Modbus register addresses, depending on the function code used to read the data. That means, a Modbus client may represent for example Modbus input register 100 with address 30101 and Modbus holding register 100 with address 40101. Meteo-40 does not use this representation. The same measurement values are available as input and as holding register. Only the register address, unique for each measurement that will be retrieved and in range 0 to 65535, must be introduced at the Modbus register table. For the previous example, only 100 should be introduced at the corresponding text box of the register table. The Modbus Master can read the data as holding or as input register. |
|
Modbus Device Identification |
Some additional information relative to the physical and functional descripton of the device is available with function code 43 (see Table 8.4, “Modbus Device Identification”). |
Table 8.3. Modbus Endianness for SCADA Server
| Representation | Byte Endianness | Word Endianness |
|---|---|---|
| AE41 5650 | Big (high byte first) | Big (high word first) |
| 5650 AE41 | Big (high byte first) | Little (low word first) |
| 41AE 5056 | Little (low byte first) | Big (high word first) |
| 5056 41AE | Little (low byte first) | Little (low word first) |
Table 8.4. Modbus Device Identification
| Object Id | Description | Type |
|---|---|---|
| 0x00 | VendorName: 'Ammonit Measurement GmbH' | ASCII String |
| 0x01 | ProductCode: Data logger serial number (e.g. 'D151234') | ASCII String |
| 0x03 | VendorURL: 'http://ammonit.com/' | ASCII String |
| 0x04 | ProductName: Data logger name (see Section 4.2, “System Administration”) | ASCII String |
| 0x05 | ModelName: Data logger type (e.g. 'Meteo-40L') | ASCII String |
Input registers contain the measurement values configured by the user. Meteo-40
SCADA server instantly writes measured values in the
Live registers and the calculated statistics after each interval in the
aggregated data registers. These data can be read with modbus function code 04. Register
addresses must be between 0 and 65535. The following values can be accessed in modbus
registers, if so configured in the table:
| Live and statistical data of all active channels |
Data logger internal values (
Int. Voltage (V),
Int. Current (mA) and
Int. Temperature (°C)) |
| Switches state |
| Unix Time (for live data and start/end of current statistics interval) |
Live data time stamp (
Live Date/Time) |
Last second of the evaluated interval for statistical data (
Statistics Date/Time) |
Holding registers can be both read or written. If
Write measurements to holding registers is selected, the measurement
values from the Input registers table will be also written in the same register numbers
from the Holding registers table. They can be read with function code 03.
| Note |
|---|---|
To prevent holding registers from being overwritten by the measurements, the
holding and input registers ranges cannot overlap if
|
Holding registers can be written by the SCADA client in order to achieve any of the following implemented functionalities.
- Date/Time synchronization
To synchronise data logger date and time over Modbus, configure the start holding register number for the date/time value ( Set Date/Time). By means of a single modbus frame and function code 16 (write multiple registers), year, month, day, hour, minute and second must be written in six subsequent registers, starting at the previously configured register (16-bit unsigned short values).
A successful syncronization will be logged in the logbook
Important It is necessary to allow date and time synchronization over SCADA in Section 4.2, “System Administration”.
- Set switches state
If a register number is configured in Set switches state, it is possible to set the current state of the switches. You can use modbus function code 6 (write single register) to control the state of all 8 switches with one telegram or function code 5 (write single coil) to set the state of only one switch.
In the first case, you must write write into the configured register the integer representing the state of all switches. Each bit determines the state of one switch:"0" for open, "1" for closed switch.
In the second case the configured register is the first address and corresponds to S1. To change the state of switch 'n' (Sn) you must write the coil address
- Stored Data Request
To request stored data using Modbus, the holding register for the retrieved unix time and the first input register for the retrieved data must be configured. Scale factor and data type configuration from the input registers table will be applied.
Retrieved Unix Time contains the register number where the timestamp of the required period must be written. With a single Modbus telegram and function code 16 (write multiple registers), the timestamp must be written as a 32-bit unsigned long in two subsequent holding registers. The statistic values of the first interval starting after the required timestamp is returned.
First input register for retrieved data contains the number of the first register where the requested stored data will be available. This offset will be added to the number in the input registers table and the corresponding measurement value will be available there.
All values from the Stored Data Retrieval range are written in the Modbus store with an atomic operation. This guarantees that the time-stamps, in case configured, match the measurement values read from the store.
E.g. Retrieved Unix Time = 3000, First input register for retrieved data = 4000, Unix Time Start = 100, Anemometer Wind Speed Avg = 102. To retrieve the data from 2016-1-27 15:00:00 the corresponding Unix Timestamp (1453903200) should be written in holding registers 3000 and 3001. After writing the timestamp, the Unix Time at the beginning of the requested interval will be available at register 4000 + 100 = 4100 and the average wind speed for the requested interval will be available at register 4000 + 102 = 4102.
Note In case that no valid measurement values were available for the requested period, the first available period will be returned. It is highly recommended to verify the unix timestamp of the returned data.
An easy way to cascade two or more Meteo-40 data loggers to get more measurement channels, is to use one Meteo-40 as RS485 SCADA master, and up to four Meteo-40 as RS485 slaves. All data loggers have to be connected as an RS485 bus.
Please be aware of the following characteristics of the RS485 cascading:
Due to the additional communication involved, there is a delay on the cascaded channels, between 1 and 2 seconds. For most applications, where only 10 minute average data is relevant, this should not be a problem.
The CECS of the slave or slaves must be always active, leading to a higher energy consumption.
The slave or slaves do not necessarily have a connection to the Internet. If there is no additional modem or a router, the data loggers cannot be accessed from remote nor can receive software updates easily.
The master can only read up to 20 Modbus registers per slave in one read instruction. Instead of using four Meteo-40 slaves, one can also configure the same Meteo-40 up to four times to read different register sets. This allows reading up to 80 Modbus registers from one slave.
Care has to be taken, that master and slave configuration fit exactly.
The Meteo-40 slave or slaves need to be configured as a SCADA device with Modbus RTU protocol and a unique Modbus unit identifier. Note, that if you need to share more than 20 registers with the master, Meteo-40 will need more than one read requests. Meteo-40 can perform until 8 read requests per second, of 20 registers each. The CECS must be always active.
At the master side, every slave has to be added as a RS485 sensor ( / ), introducing slave's unit identifier as RS-485 address. If you need to request more than 20 registers from one slave, you must do this configuring two different sensors with the same slave unit identifier. After selecting the corresponding data type, the resulting evaluations must show the same measurement value as at the slave. For each of the measurement values you should configure a custom evaluation using a linear equation in order to confer it the known unit and data type (see Evaluation Helper).
To ensure compatibility with Ammonit Meteo-32 data loggers, Meteo-40 offers serial streaming via RS485 S (slave) port. So Meteo-40 can easily replace operating Meteo-32 data loggers in SCADA systems.
After activating Meteo-40 for SCADA in menu → , select Meteo-32 Stream as SCADA protocol and the required RS485 serial settings (baud rate and data format). Save the settings.

In order to set up Meteo-40 for Meteo-32 streaming, configure the Stream Map. Open it via Edit Meteo-32 stream map. The stream map displays all active channels and evaluated data. For data retrieval, special codes have to be entered (unlike Modbus register map!). Refer to Table 8.6, “Channel Codes for Meteo-32 Stream Map” and Table 8.7, “Statistic Codes for Meteo-32 Stream Map” as well as the example in Figure 8.5, “SCADA Meteo-32 Stream Map”.
Table 8.6. Channel Codes for Meteo-32 Stream Map
| Sensor | Code | Unit | Example | ||||
|---|---|---|---|---|---|---|---|
| Anemometer | s | 0.1 m/s |
| ||||
| Wind Vane | d | degree |
| ||||
| Ultrasonic (horizontal wind speed) | u1 | 0.01 m/s | |||||
| Ultrasonic (wind direction) | u2 | degree | |||||
| Ultrasonic (vertical wind speed) | u3 | 0.01 m/s | |||||
| Humidity | h | % Frel |
| ||||
| Temperature | t | 0.1 K |
| ||||
| Air Pressure | b | hPa |
| ||||
| Pyranometer | r | W/m² |
| ||||
| Precipitation | p | 0.1 mm/min | |||||
| Analog Voltage | v | 0.1 mV |
| ||||
| Counter Input | c | 0.1 Hz |
| ||||
| Status Input | i | % on |
| ||||
| Int. Temperature | ti | °C + 40 |
| ||||
| Int. Voltage | vx | V |
| ||||
| Int. Current | ic | mA |
|
Table 8.7. Statistic Codes for Meteo-32 Stream Map
| Value | Code |
|---|---|
| Average | a |
| Standard Deviation | s |
| Minimum | i |
| Maximum | x |
Click on Save to finish the configuration.